

🏆 What is the best city for real estate agents in 2024? 🏆
Detroit took first place, propelled to the top by nearly 5x as many sales per agent as the median market, the lowest competition from fellow agents, and some of America’s highest commission rates.
Best Cities for Real Estate Agents, Ranked | Top 15 Markets for Real Estate Agents | Rankings by Category | 10 Worst Cities for Real Estate Agents | Methodology | FAQ
Real estate agents spend their days — and often their nights and weekends, too — helping their clients find properties in places they’re excited to call home. Although Realtors are a critical part of the process in any city, there are some significant differences among metros when it comes to their earnings, agent competition, typical commission rates, and other factors. As the sizzling housing market of the past few years has cooled off, those gaps are becoming more noticeable than ever.
Realtors looking for a change of scenery or to get their careers off on the right foot should hit the road for the Motor City. Detroit is America’s best city for real estate agents in 2024, with full-time Realtors enjoying the highest volume of sales in the country, the lowest competition, and some of the most straightforward requirements for getting and keeping a license. It’s also one of the easiest places in the country for real estate agents to afford a home, with typical properties costing less than four years of their median salary.
It’s a similarly positive story in many Midwestern cities, with the region home to seven of the top 15 markets for real estate agents. Meanwhile, it’s a far grimmer picture for Realtors in California, America’s worst state for agents, as well as some popular, fast-growing Sunbelt cities, such as Las Vegas and Austin, Texas. Agents in these markets face a variety of challenges, from an oversupply of full-time real estate professionals and low commission rates to homes that are so expensive they can’t afford to buy them on their salaries.
To rank the top 50 U.S. metros, we considered the following data points weighted in the following manner:
- 5x: Affordability, based on years of median agent salary needed to afford a typical home
- 3x: Annual salary for real estate agents
- 3x: Number of agents per 100,000 residents
- 3x: Annual home sales per full-time agent
- 2x: Home value forecast, next 12 months
- 2x: Change in home values, last five years
- 1x: Days on market
- 1x: Listing agent commission rate (%)
- 1x: Buyer's agent commission rate (%)
- 1x: Listing agent commission on typical home ($)
- 1x: Buyer's agent commission on typical home ($)
- 1x: Real estate license reciprocity
- 1x: Hours needed to obtain a license
- 1x: Annual hours of continuing education to maintain license
Read on to learn more about America’s top cities for real estate agents, as well as the markets where their business may struggle.
🌆 2024 Best Cities for Real Estate Agents Statistics
- Detroit is the country’s top city for real estate agents, powered to first place by the highest sales per agent in the U.S., the lowest number of agents per 100,000 residents, and the second-best home affordability based on an agent’s salary.
- San Francisco Realtors experience the opposite: high competition, the fewest sales per agent, and the second-longest amount of time needed to afford a home, making it the country’s worst city for agents.
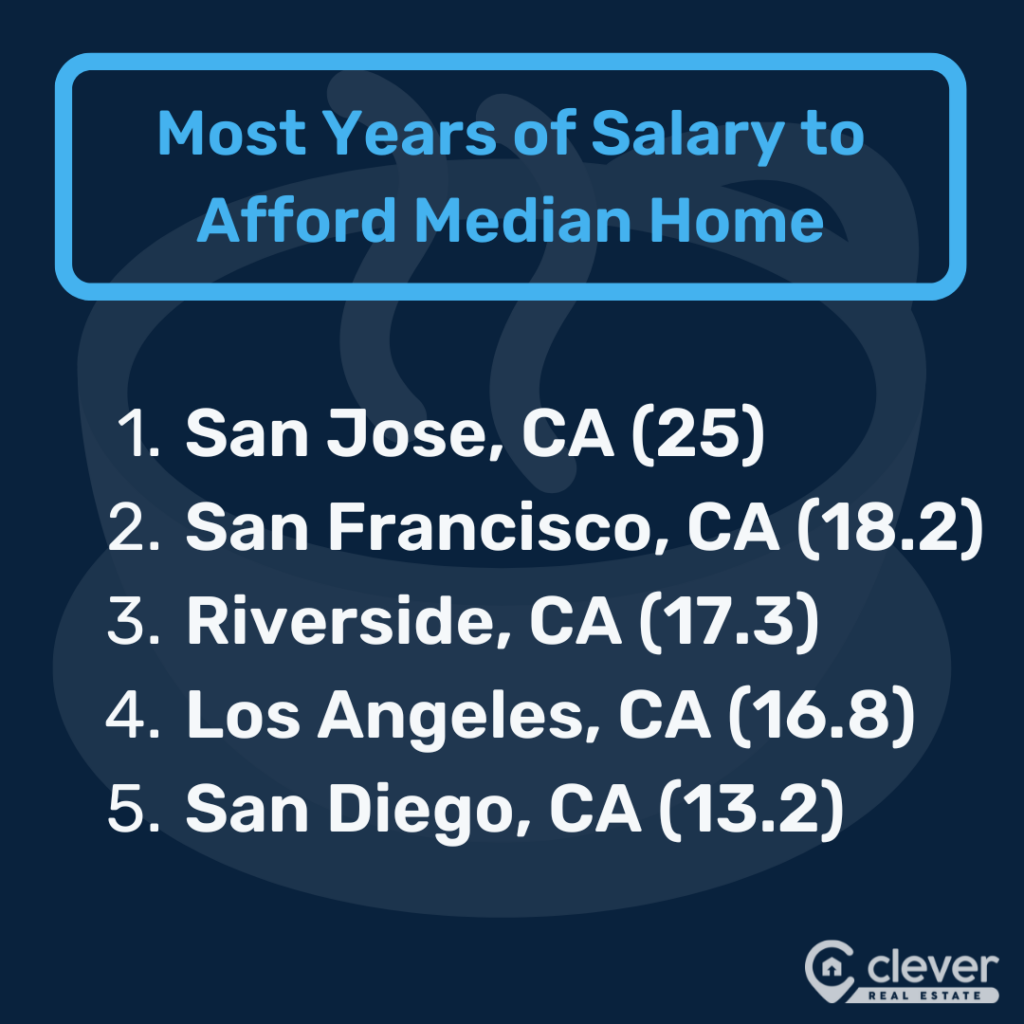
- Three other California cities – San Jose (No. 3), Los Angeles (No. 9), and Riverside (No. 10) – also make the bottom 10.
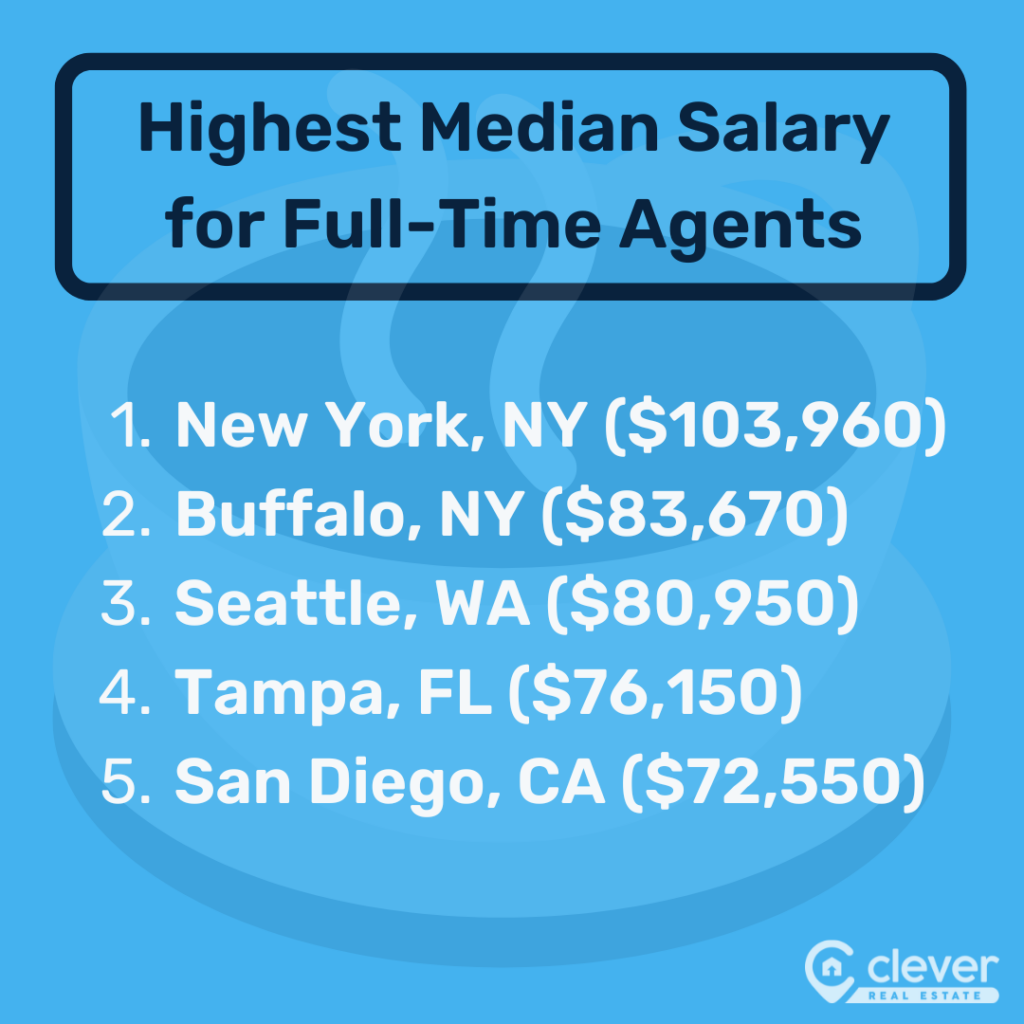
- Agents in New York City earn the highest median income, $103,960 per year. It’s the only U.S. market with a median in the six figures.
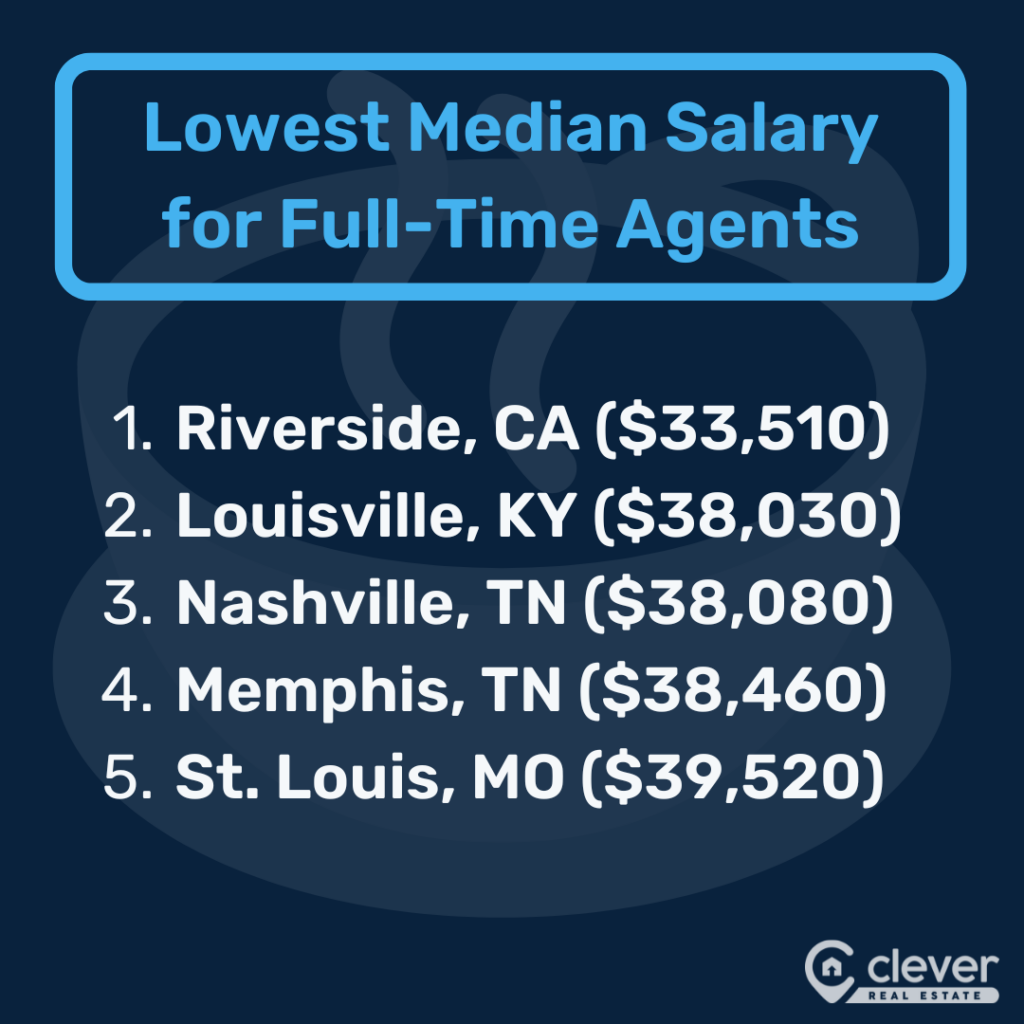
- Realtors in Riverside, California, are the lowest paid, with a typical income of just $33,510 annually.
- At 3.1%, listing agent commission is highest in Boston (No. 19), followed by Ohio cities such as Columbus (No. 6), Cleveland (No. 14), and Cincinnati (No. 22) at 3.08%.
- In dollars, listing agents in San Jose, California, earn the highest average listing commission — $43,930 per property sold. It’s also the top city for buyer’s agents, who bring in $39,358 per deal.
- Buyer’s agent commission rates are highest in Louisville, Kentucky, where they average 3%. Detroit is second at 2.96%.
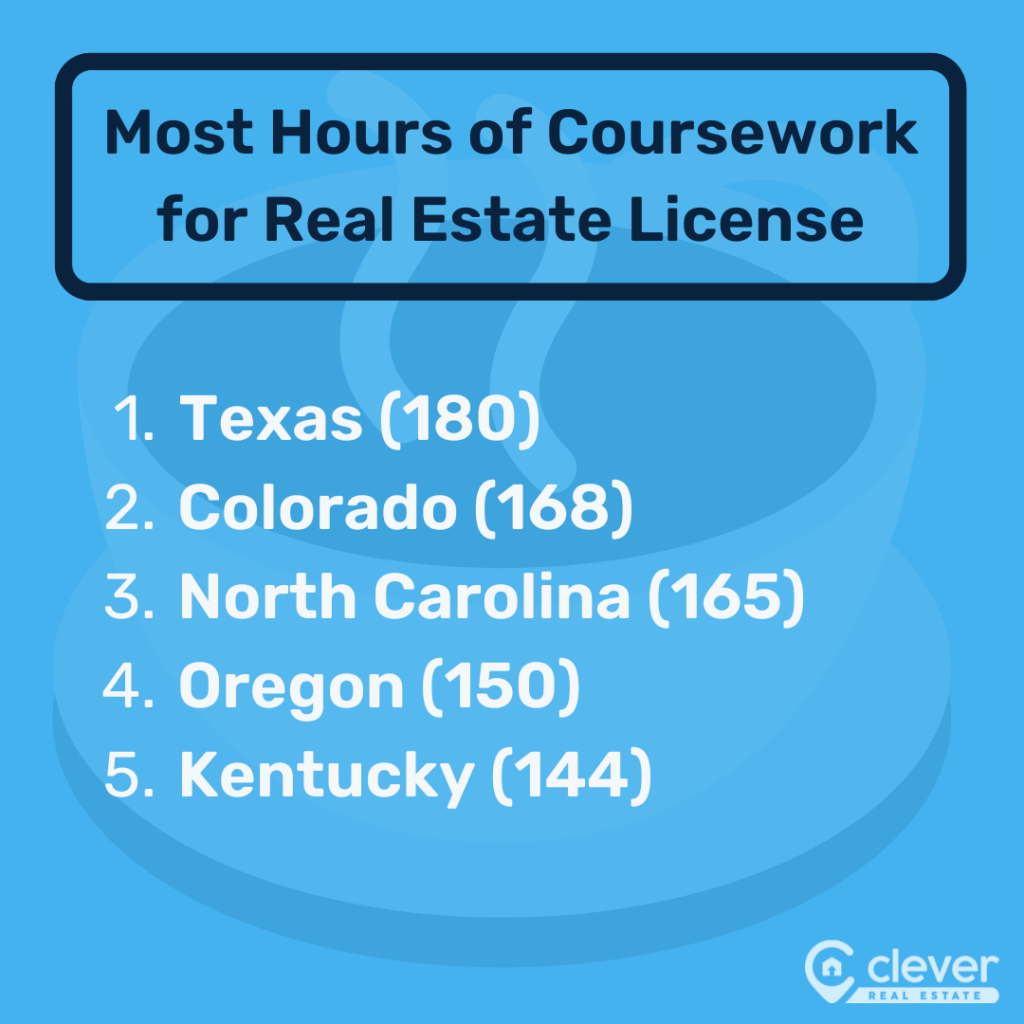
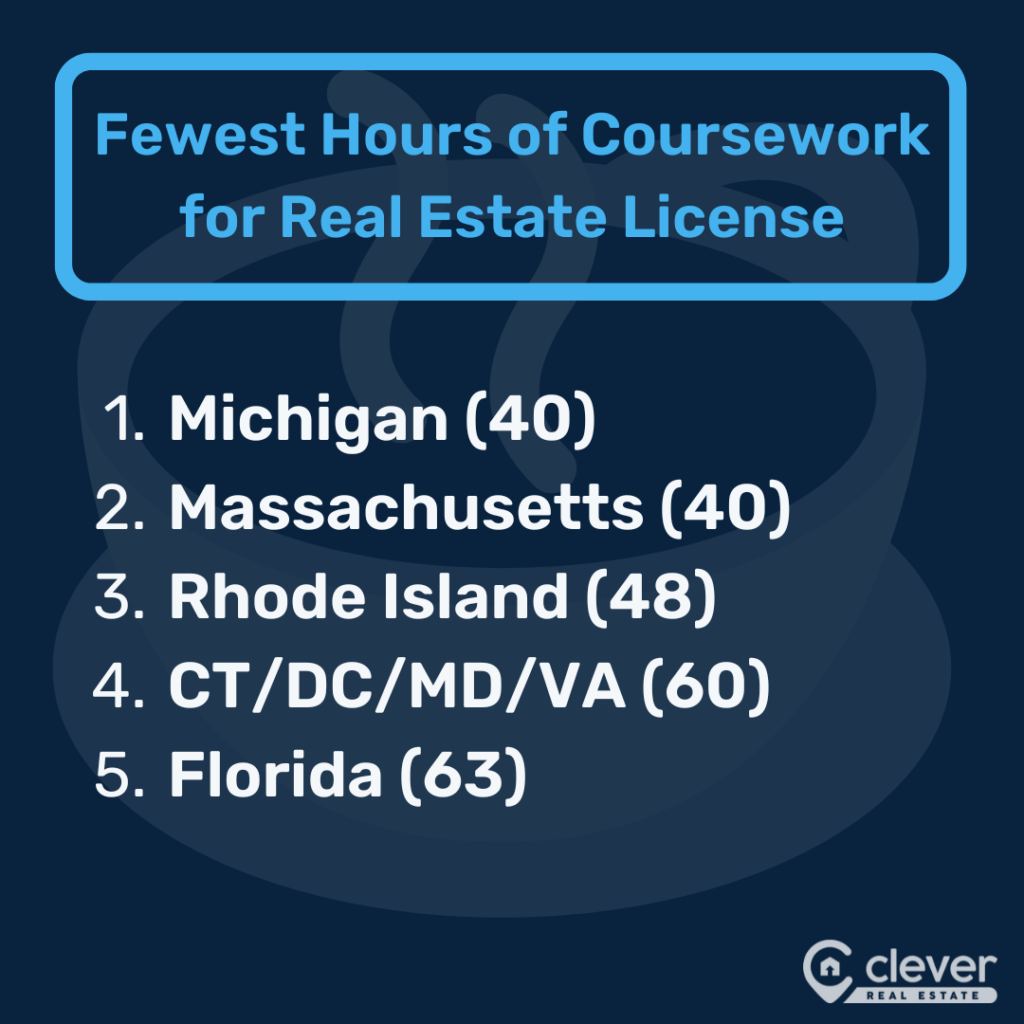
- Texas cities — Dallas, Austin, San Antonio, and Houston — require the most time to obtain a real estate license at 180 hours. That’s a full 12 hours more than the next market, Denver.
- In contrast, agents working in Boston and Detroit need just 40 hours of education.
- Regionally, seven of the top 15 cities for real estate agents are located in the Midwest. The Northeast and South have four each.
- None of the top 15 markets for Realtors is in the West. However, six of the bottom 10 are located in that region.
- Eight of the top 10 cities for Realtors offer partial or full license reciprocity, which allows agents licensed in one state to obtain a license in another without undergoing the same training and requirements for new agents.
- On the other hand, seven of the 10 worst cities have no reciprocity.
The Best Cities for Real Estate Agents, Ranked
| Rank | City | Median Annual Agent Income | Agents per 100K Residents | Years to Buy Home on Median Agent Salary | Median Days on Market | Homes Sold per Full-Time Agent, Past 12 Months | Listing Agent Commission | Buyer's Agent Commission | Projected Property Value Change, Next 12 Months | Property Value Growth, Last 5 Years |
| - | Average City | $50,345 | 63.5 | 7.7 | 40.5 | 18 | 2.82% | 2.67% | ||
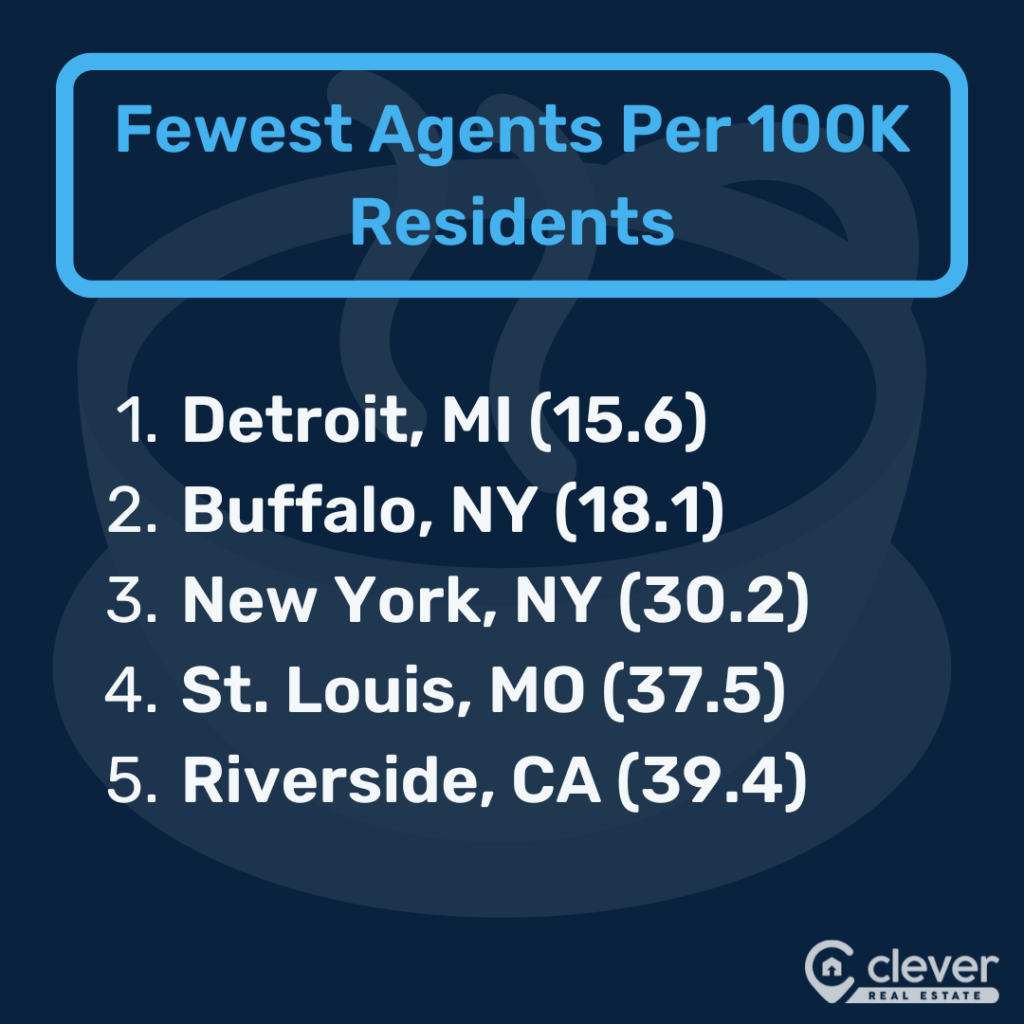
| 1 | Detroit, MI | $63,910 | 15.6 | 3.9 | 33 | 89.1 | 2.96% | 2.96% | -1.2% | 41.3% |
| 2 | Buffalo, NY | $83,670 | 18.1 | 3.1 | 65 | 48.6 | 3.00% | 2.39% | 1.4% | 53.5% |
| 3 | Kansas City, MO | $59,430 | 53.4 | 5.1 | 34 | 23.0 | 2.89% | 2.69% | -0.6% | 49.0% |
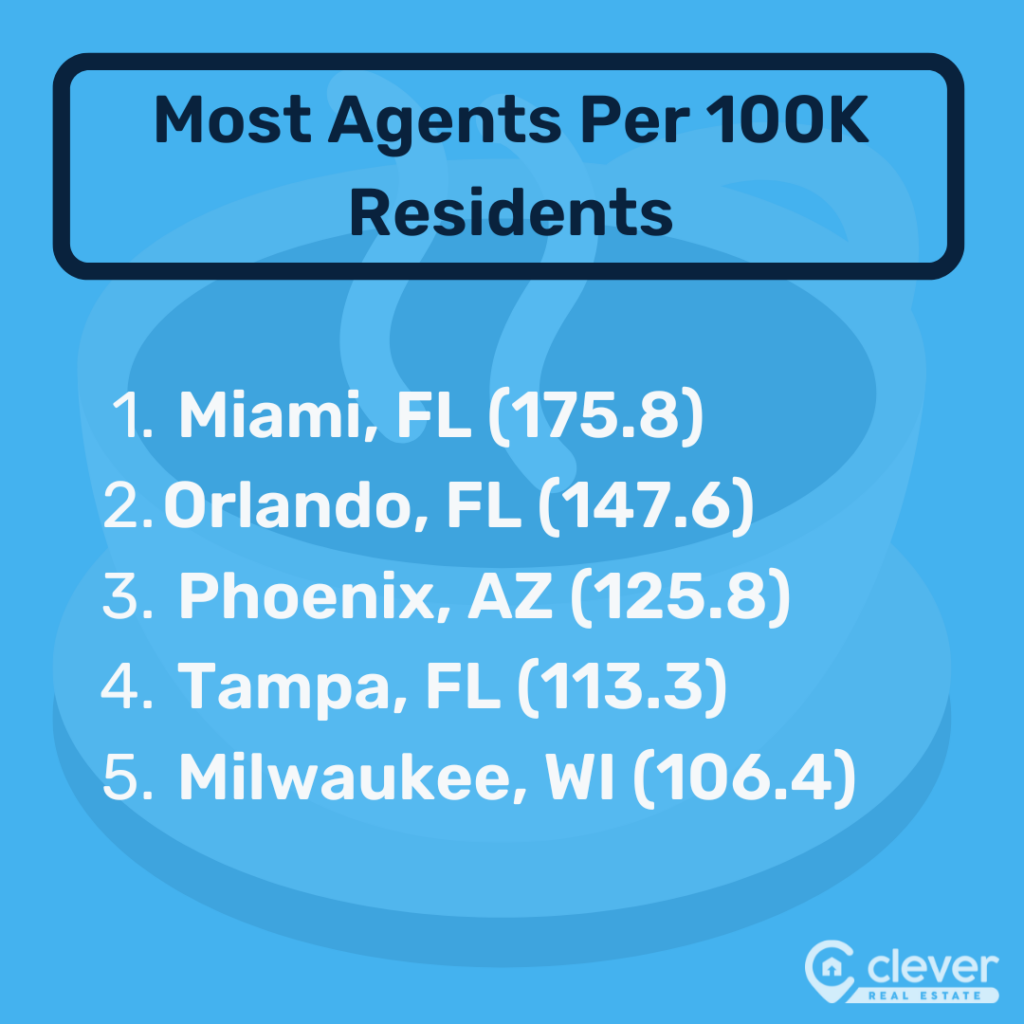
| 4 | Tampa, FL | $76,150 | 113.3 | 5.0 | 56 | 13.7 | 2.82% | 2.55% | 1.4% | 71.2% |
| 5 | Richmond, VA | $60,340 | 69.4 | 6.1 | 37 | 17.9 | 2.72% | 2.73% | 0.1% | 49.5% |
| 6 | Columbus, OH | $41,460 | 45.8 | 7.6 | 31 | 23.2 | 3.08% | 2.91% | 0.5% | 55.2% |
| 7 | Jacksonville, FL | $49,670 | 60.3 | 7.3 | 62 | 24.6 | 2.82% | 2.55% | 0.2% | 58.6% |
| 8 | Atlanta, GA | $50,020 | 73.6 | 7.7 | 43 | 18.3 | 2.93% | 2.88% | 0.6% | 61.8% |
| 9 | Pittsburgh, PA | $50,790 | 41.7 | 4.2 | 46 | 30.4 | 2.81% | 2.67% | -2.1% | 35.1% |
| 10 | Hartford, CT | * | * | * | 40 | * | 2.97% | 2.50% | 0.7% | 54.6% |
| 11 | New York, NY | $103,960 | 30.2 | 6.3 | 69 | 24.2 | 3.00% | 2.39% | -2.2% | 32.6% |
| 12 | Chicago, IL | $52,300 | 42.2 | 6.1 | 39 | 25.4 | 2.75% | 2.60% | -1.9% | 33.8% |
| 13 | St. Louis, MO | $39,520 | 37.5 | 6.4 | 35 | 38.8 | 2.89% | 2.69% | -1.3% | 41.9% |
| 14 | Cleveland, OH | * | 46.5 | * | 37 | 24.9 | 3.08% | 2.91% | -0.1% | 46.2% |
| 15 | Indianapolis, IN | $61,530 | 104.1 | 4.6 | 37 | 12.9 | 2.73% | 2.82% | 0.4% | 56.7% |
| 16 | Providence, RI | * | * | * | 44 | * | 3.00% | 2.50% | 0.5% | 53.8% |
| 17 | Virginia Beach, VA | $56,110 | 65.9 | 6.2 | 42 | 22.0 | 2.72% | 2.73% | -1.0% | 43.6% |
| 18 | Birmingham, AL | $55,110 | 68.9 | 4.6 | 40 | 21.9 | 2.75% | 2.70% | -1.1% | 44.1% |
| 19 | Boston, MA | * | * | * | 44 | * | 3.10% | 2.35% | -0.9% | 42.2% |
| 20 | Charlotte, NC | $46,710 | * | 8.2 | 41 | * | 2.88% | 2.63% | 1.7% | 65.5% |
| 21 | Memphis, TN | $38,460 | 47.3 | 6.3 | 48 | 28.4 | 2.77% | 2.82% | 0.2% | 54.5% |
| 22 | Cincinnati, OH | $40,890 | 65.8 | 6.9 | 33 | 18.0 | 3.08% | 2.91% | 0.0% | 50.8% |
| 23 | San Diego, CA | $72,550 | 54.3 | 13.2 | 33 | 14.3 | 2.69% | 2.41% | 1.1% | 57.6% |
| 24 | Oklahoma City, OK | * | * | * | 44 | * | 3.05% | 2.90% | -0.6% | 47.7% |
| 25 | Baltimore, MD | $46,850 | 44.8 | 8.2 | 34 | 27.8 | 2.76% | 2.58% | -2.7% | 32.0% |
| 26 | Philadelphia, PA | $47,370 | 62.5 | 7.6 | 41 | 18.1 | 2.81% | 2.67% | -0.6% | 47.1% |
| 27 | Denver, CO | * | * | * | 34 | * | 2.80% | 2.83% | -2.0% | 38.2% |
| 28 | Washington DC | $66,560 | 68.9 | 8.5 | 31 | 15.2 | * | * | -2.5% | 31.9% |
| 29 | Raleigh, NC | $44,650 | * | 10.0 | 40 | * | 2.88% | 2.63% | 0.6% | 56.9% |
| 30 | Salt Lake City, UT | $59,640 | 71.1 | 9.2 | 36 | 14.4 | 2.30% | 2.60% | -0.3% | 52.8% |
| 31 | Minneapolis, MN | $44,270 | 41.7 | 8.5 | 41 | 28.1 | 3.05% | 2.77% | -3.4% | 29.5% |
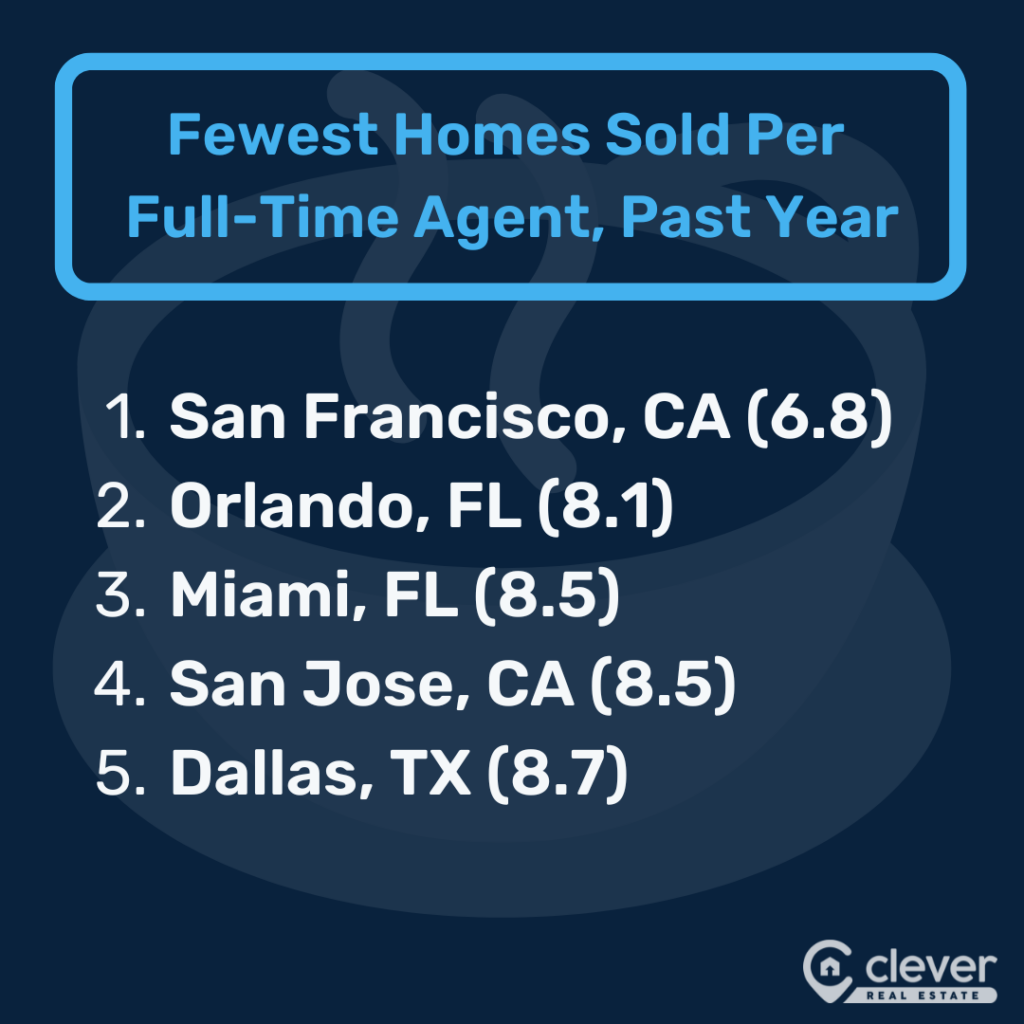
| 32 | Miami, FL | $54,950 | 175.8 | 8.9 | 67 | 8.5 | 2.82% | 2.55% | 0.9% | 67.0% |
| 33 | Seattle, WA | $80,950 | 104.6 | 9.3 | 32 | 9.4 | 2.75% | 2.51% | -0.9% | 45.5% |
| 34 | Sacramento, CA | $60,850 | 43.4 | 9.6 | 32 | 21.2 | 2.69% | 2.41% | -2.1% | 36.6% |
| 35 | Nashville, TN | $38,080 | 63.5 | 11.6 | 44 | 23.3 | 2.77% | 2.82% | 0.3% | 53.9% |
| 36 | San Antonio, TX | $49,670 | 61.4 | 5.9 | 63 | 14.2 | 2.86% | 2.87% | -2.1% | 39.6% |
| 37 | Houston, TX | $50,670 | 104.6 | 6.1 | 49 | * | 2.86% | 2.87% | -1.5% | 41.1% |
| 37 | Louisville, KY | $38,030 | 81.7 | 6.8 | 38 | 15.4 | 3.00% | 3.00% | -1.5% | 39.8% |
| 39 | Portland, OR | $62,570 | 50.2 | 8.9 | 38 | 19.8 | 2.61% | 2.42% | -2.8% | 34.2% |
| 40 | Orlando, FL | $46,190 | 147.6 | 8.6 | 53 | 8.1 | 2.82% | 2.55% | 0.3% | 61.1% |
| 41 | Riverside, CA | $33,510 | 39.4 | 17.3 | 45 | 23.7 | 2.69% | 2.41% | 0.0% | 54.7% |
| 42 | Los Angeles, CA | $57,180 | 52.8 | 16.8 | 40 | 10.5 | 2.69% | 2.41% | -0.5% | 44.3% |
| 43 | Phoenix, AZ | $48,640 | 125.8 | 9.5 | 49 | 10.1 | 2.69% | 2.75% | 1.2% | 63.5% |
| 44 | Las Vegas, NV | $44,380 | 89.5 | 9.6 | 43 | 14.6 | 2.90% | 2.90% | -0.1% | 45.0% |
| 45 | New Orleans, LA | $47,030 | 61.8 | 5.2 | 63 | 14.4 | 2.89% | 2.67% | -6.3% | 9.7% |
| 46 | Milwaukee, WI | $46,590 | 106.4 | 7.4 | 37 | 10.4 | 2.74% | 2.46% | -0.7% | 43.8% |
| 47 | Dallas, TX | $44,150 | 105.7 | 8.6 | 43 | 8.7 | 2.86% | 2.87% | -0.9% | 49.2% |
| 48 | San Jose, CA | $65,370 | 74.3 | 25.0 | 32 | 8.5 | 2.69% | 2.41% | -1.7% | 33.2% |
| 49 | Austin, TX | $47,830 | 92.9 | 9.8 | 55 | 9.5 | 2.86% | 2.87% | -2.2% | 48.8% |
| 50 | San Francisco, CA | $65,190 | 103.7 | 18.2 | 33 | 6.8 | 2.69% | 2.41% | -3.6% | 23.4% |
15 Best Cities for Real Estate Agents
1. Detroit, MI
| 🎸 Detroit Sales City Detroit real estate agents are the busiest of any market in the country, with full-time agents selling an average of 89.1 homes over the past year. That's the highest in our study and nearly 5x the amount in the median city (18). |
Realtors in the Motor City achieve this incredible volume by selling homes 19% faster than the typical market. Detroit homes usually sit on the market for just 33 days, compared to 40.5 days in the average city.
They also benefit from far less competition, with just 15.6 full-time agents per 100,000 residents. That's a whopping 75% lower than the median market, which has 63.5 Realtors per 100,000 residents.
You can't blame the paltry number of agents on difficulty getting a license. Detroit has the lowest training requirements among all cities studied. Residents need only 40 hours of coursework to become an agent, less than half the typical requirement of 90 hours.
Those willing to complete that modest training are rewarded with the second-highest average buyer's agent commission, with a statewide average of 2.96%. That's nearly 11% more than buyer's agents in the typical market, who make 2.67%. Listing agents also make more than the median market at 2.96% versus 2.82%.
That's an extra $712 per purchase for buyer's agents and $344 for listing agents based on the median Michigan sale price of $245,683.
The combination of high sales volume, low competition, and high commission rates produces a median salary of $63,910 for agents, the ninth highest in our study. This is 27% higher than the average city, where agents make a median salary of $50,345.
That helps make Detroit the second-most affordable place for Realtors to live, based on their typical salary. It takes 3.9 years of the median real estate agent's income to afford the median home in the Detroit area, about half the average length of 7.7 years nationwide.
2. Buffalo, NY
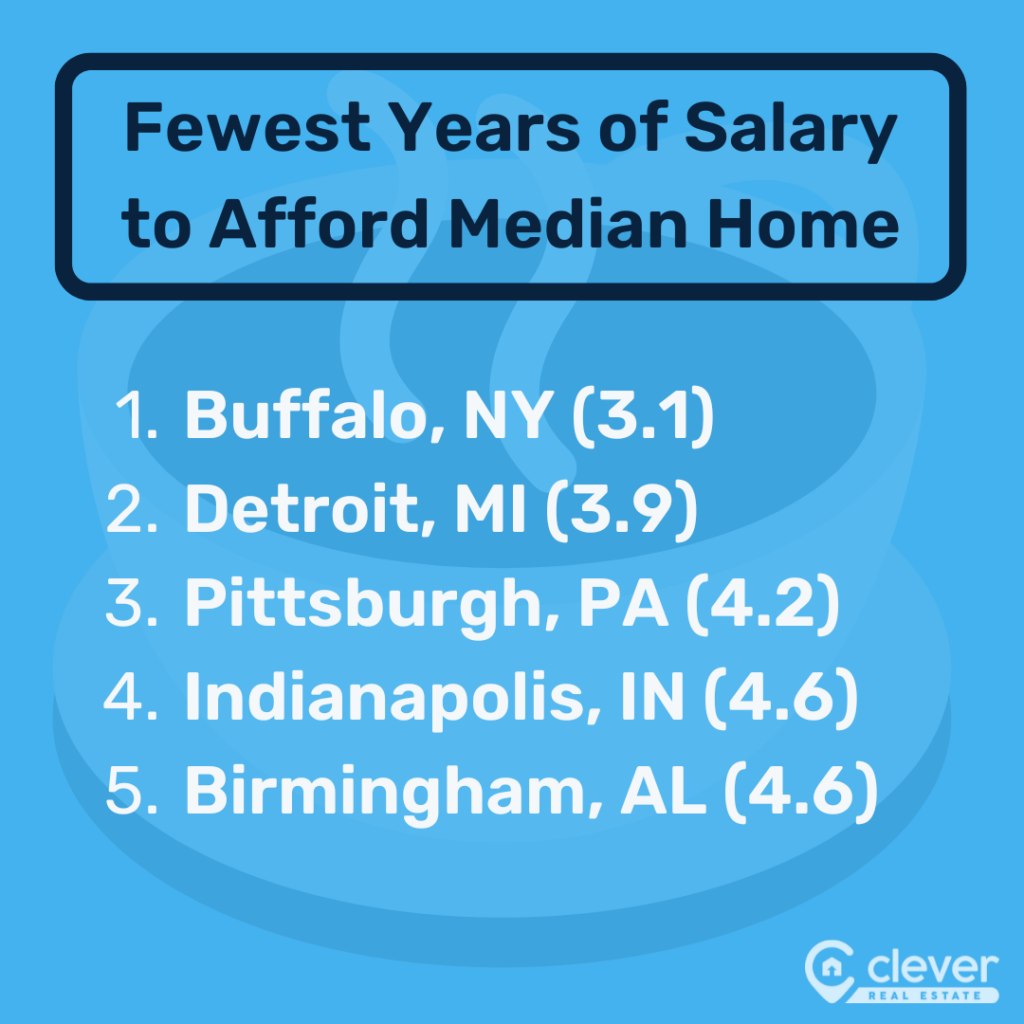
| 🏡 Home Sweet Affordable Home It’s more affordable for real estate agents to buy a home in Buffalo on their typical salary than in any other city. Realtors need just 3.1 years of the median income to afford an average property, less than half the time it takes in the median city (7.7 years). |
Buffalo agents can thank their market’s relatively strong salaries for this perk. Realtors make a median of $83,670 annually, which is second best among all cities studied and 66% higher than the typical one, which has a median salary of $50,345.
There’s no doubt Buffalo agents are working for that higher paycheck, as the market has seen 48.6 home sales per full-time Realtor over the past year. That’s the second-highest in the country and more than double the median (18).
Agents stay so busy because Buffalo has the second-lowest number of real estate agents per 100,000 residents at just 18.1. The average city studied had more than 3x as many agents, 63.5 per 100,000 residents.
Buffalo also scores highly when it comes to future home prices. The market has the second-best Zillow home value forecast over the next 12 months. Property values are expected to grow by 1.4%, compared to a 0.6% decrease in the median market.
3. Kansas City, MO
| 🌳 Putting Down Realtor Roots Kansas City is another market ideal for real estate agents settling down for the long term. The median home in the Kansas City area costs 5.1 years of a typical agent’s salary, 33% lower than the median market studied (7.7 years). |
Although Kansas City may not top the rankings for any individual category, strong performance across many of the metrics in our study landed it a respectable bronze medal.
Kansas City agents earn a median salary of $59,430, which is 18% higher than average ($50,345). By a similar magnitude, KC Realtors enjoy less competition from other agents, with 16% fewer agents per 100,000 residents (53.4) than the median market (63.5).
In addition, homes sell 16% faster, spending just 34 days on the market compared to 40.5. That helps full-time agents sell a median of 23 homes per year, 27% more than the 18 in the average city.
Getting a real estate license is also relatively straightforward in Missouri. Residents must complete 72 hours of education to obtain it and six hours annually to keep it, compared to a nationwide median of 90 hours and nine hours, respectively. Plus, Missouri offers full license reciprocity to agents moving from other states, allowing them to begin working with minimal additional licensing requirements.
4. Tampa, FL
| 🌞 Sunshine and Strong Salaries Full-time real estate agents in Tampa make the fourth-highest median salary of any market studied. They bring in $76,150 per year, 51% more than the studywide median of $50,345. |
Tampa Realtors have benefited from some historic price increases in recent years, with home values rising 71.2% since 2019 – the most in the U.S. in that time period. That's significantly higher than the median city, where prices grew 46.7% during the same period.
The good times don’t look like they’re over yet. The Zillow home value forecast for Tampa shows expected growth of 1.4% over the next year, while the median city will see a drop of 0.6% instead.
Even after these major price hikes, Tampa remains one of the more affordable cities for real estate agents to purchase a home based on their salary. It’s sixth lowest among cities studied, taking five years compared to 7.7 years. That’s 35% lower.
In addition, Tampa ranks ninth when it comes to ease of getting a real estate license. The 63 hours needed is 30% lower than the median of 90. There’s also good news for Realtors among the many recent transplants moving to the Sunshine State: Florida offers partial license reciprocity.
5. Richmond, VA
| 🎓 Old Dominion, New Agents Would-be Realtors looking to set up shop in Virginia's capital city won't have to spend long studying for their exam. Richmond has the fourth-lowest amount of coursework required at just 60 hours. That's a third less than the median city, where 90 hours of education are needed. |
Meanwhile, Richmond features full real estate license reciprocity for agents relocating from other markets. Whether they're new arrivals or lifelong Virginians, agents in Richmond earn a median salary of $60,340. That's approximately 20% higher than the typical city in our study ($50,345).
These strong earnings help make Richmond an affordable place to buy a home, requiring just 6.1 years of the median agent's salary to afford the average home. That's 1.6 fewer years than the median city studied (7.7).
Even amid the active real estate market over the past few years, Richmond outpaced the typical city, growing 49.5% since 2019 — 6% higher than the median market. Prices in Richmond are also expected to hold up relatively well compared to other markets nationwide. The Zillow home value forecast over the next 12 months is essentially flat, while the median city is expected to decline 0.6%.
6. Columbus, OH
| 🏃 Homes Today, Gone Tomorrow Real estate agents won't be stuck with listings for long in Columbus, which is home to the nation's speediest housing market. Properties generally spend just 31 days on the market, 24% lower than the median city, where they take 40.5 days to sell. |
This rapid pace is likely a key factor in allowing full-time Realtors in Columbus to sell a median of 23.2 homes per year, 28% higher than average (18). At the same time, Columbus (45.8) is home to 28% fewer agents per 100,000 residents than the median city (63.5). That's the 11th lowest in the country.
Without the high competition of other markets, Realtors can set relatively high commission rates. Ohio's average listing agent commission is 3.08%, the second highest in our study. Meanwhile, the average buyer's agent commission is 2.91%, which is the third highest. Both commission rates are roughly 9% higher than in the median city.
Finally, expectations for the Columbus market over the next year are relatively strong, with a Zillow home value forecast (0.5%) that is more than 1% higher than that of the median city (-0.6%). It follows a 55% increase in home values over the past five years, which is 18% higher than the typical market (46.7%).
7. Jacksonville, FL
| 🏖 Busy Near the Beach Realtors working in this northern Florida metro aren’t short on listings, with the typical full-time agent selling 24.6 homes over the past 12 months. That’s the 10th best in the country and more than 36% higher than the median market. |
Like other Florida cities that have gained a significant number of new residents in recent years, Jacksonville has seen strong home price growth. Realtors have benefited from a 58.6% rise since 2019, the seventh-highest gain of any city studied. Still, agents making a typical salary can buy an average home in Jacksonville with 7.3 years of income, less than the nationwide median of 7.7 years.
Recent arrivals who have previously earned their license in another state have partial reciprocity in Florida, while new agents need only 63 hours of coursework to obtain theirs. That’s 30% lower than the overall median of 90.
8. Atlanta, GA
| 🍑 Peachy Price Growth in Georgia Atlanta has seen a 61.8% increase in home values over the past five years, the fifth highest among cities in our study. That's 32% higher than in the median city in our study. |
Like in other fast-growing cities in the Southeast and Southwest, Atlanta agents have reaped the rewards of positive trends in where Americans are moving. But unlike some, Atlanta prices are expected to hold up, even as the nationwide market may be headed for a dip.
Atlanta's Zillow home value forecast over the next 12 months indicates growth of 0.6%, the eighth-highest forecast among cities in our study. That's compared to the median city we studied, where prices are projected to drop 0.6%.
Realtors in Georgia also earn slightly better commission rates than the typical market. Buyer's agents take home an average of 2.88%, which is 8% higher than the median rate and eighth highest overall. Listing agents earn 4% more than average, receiving an average of 2.93% per sale.
Those who have already earned their real estate license elsewhere can get to work relatively quickly by taking advantage of Georgia's full reciprocity. In addition, people studying to be agents will only need to put in 75 hours, 17% fewer hours than the median (90).
9. Pittsburgh, PA
| 🏘 Buying in the ‘Burgh Buyers with a typical Pittsburgh real estate agent’s salary can afford a home in the City of Bridges with just 4.2 years of income. That’s the third best among all cities studied and 45% lower than the median city (7.7 years). |
There’s not much competition in this mid-sized market, either. Pittsburgh is home to 41.7 full-time agents per 100,000 residents, the seventh-lowest number in our study. It’s a third (34%) less than the typical city, which has 63.5. This means there are plenty of opportunities for each agent, with 30.4 sales per year compared to 18 in the median market.
Pittsburgh also makes getting and keeping a real estate license relatively easy, requiring 75 hours initially and seven hours each year. Both are lower than the medians of 90 and nine, respectively. Even better, Pennsylvania offers partial real estate license reciprocity, helping clear a few hurdles for agents relocating there.
» Read more stats on Pennsylvania
10. Hartford, CT
| 💪 Holding Strong in Hartford After years of substantial gains, the Zillow home value forecast predicts a 0.6% decline for the typical market over the next 12 months. However, Hartford is projected to buck that trend and grow at the seventh-highest rate (0.7%) of any market in our study. |
It’s not as if Hartford missed out on the roaring real estate market over the past few years, either. Since 2019, home values in the area have grown 54.6%. That is 17% higher than the median city, which saw 46.7% gains.
Hartford also benefits from Connecticut’s relatively low requirements to become an agent. Would-be Realtors can get their license with 60 hours of coursework, the fourth lowest among cities studied. It’s just two-thirds of the median requirement of 90 hours.
The pay is respectable, too, with statewide listing agent commission rates averaging 2.97%, the 11th best overall.
» Read more stats on Connecticut
11. New York, NY
| 🤑 Big Bucks in the Big Apple Real estate agents with their eyes on the biggest salary should head to the New York market, where they earn a median income of $103,960. It’s the only U.S. city where that reaches six figures. It’s also more than double the salary in the typical market, where agents make a median of $50,345. |
Big earnings are possible thanks to the region’s high home prices, which allow Realtors to take home significant chunks of cash per transaction. The average listing agent brings in $19,625 per sale, while the average buyer’s agent earns $15,635 for each.
In addition, New York has relatively few Realtors for the market’s massive population. There are just 30.2 full-time agents per 100,000 residents, fewer than half the 63.5 in our median city. That’s the third lowest overall. Realtors working in the market take advantage of this, selling 24.2 homes per full-time agent, compared to 18 in the typical city.
The result is that it’s reasonably affordable for Realtors to buy a home in the New York area, at least relatively speaking. It takes 6.3 years of the median real estate agent's salary to afford the median home. That's 18% lower than the median city in our study, where it takes 7.7 years.
12. Chicago, IL
| 🌬 Blown Away by Windy City Opportunities Chicago may be known as the Second City, but it's actually the eighth lowest when it comes to the number of real estate agents relative to its population. The market has 42.2 full-time Realtors per 100,000 residents, 34% lower than the median city, which has 63.5. |
It’s also the eighth-best city for sales per agent. Chicago-area real estate agents (25.4) sold 41% more properties in the past year than Realtors in the median city (18).
Chicago is noteworthy among America’s largest cities for its relatively affordable housing. Agents making the market's median salary of $52,300 need roughly 6.1 years to afford the typical home, compared to 7.7 years in the average market.
13. St. Louis, MO
| 🔑 Gateway to Sales St. Louis agents certainly don’t have to sit around waiting for clients, with Realtors selling the third-most homes of any city studied. Full-time agents have sold 38.8 properties over the past 12 months, more than double the median city (18). |
Like other top markets, high sales are partly due to low competition. St. Louis has the fourth-lowest number of agents among all cities in our study. The Gateway to the West is home to 37.5 full-time agents per 100,000 residents, 41% lower than the median city, which has 63.5.
However, a combination of hard work and strong demand also helps, with St. Louis homes (35 days) spending 14% less time on the market than the typical city (40.5).
Missouri also offers full real estate license reciprocity for agents from other states. That’s not to say St. Louis isn’t also an excellent place for new agents to get started. Missouri agents only need 72 hours of coursework to obtain their real estate license, 20% fewer hours than the median city in our study, which requires 90.
Of course, what may matter most to real estate agents is whether they can afford to live in a market, and that’s definitely the case in St. Louis. The median home in the area costs 6.4 years of a typical St. Louis Realtor’s salary, compared to 7.7 years in the median city.
14. Cleveland, OH
| 🤘 Agents Rockin’ and Rollin’ in Cleveland Realtors may feel like a star in Cleveland, where they’ve had 24.9 home sales per full-time agent over the past year, the ninth most in our study. It’s an impressive 38% more than the median city, where full-time agents sold 18. |
In addition, the Cleveland market has 27% fewer full-time agents than the median market, with just 46.5 per 100,000 residents. This ensures plenty of opportunities for new agents to get started, while partial license reciprocity makes relocating easier.
Cleveland also gets a boost from Ohio’s strong statewide commission rates. Listing agents earn an average of 3.08% — the second-highest rate in the study — while buyer’s agents take home an average of 2.91%, the third best overall. Realtors will also enjoy the area’s lower median days on market, 37 versus 40.5 for the typical city. That means homes sell 9% faster.
15. Indianapolis, IN
| 🏎 Speedway to Buying a Home It may not be an Indy 500 pace, but Indianapolis real estate agents making the median salary can buy a typical home in 4.6 years – 40% faster than in the average market, where it takes 7.7 years. |
The city’s love for speed also makes itself known with a quicker-than-average turnaround for homes on the market. They spend 37 days on the market, 9% less than the median city (40.5).
Realtors in Indianapolis benefit from a median salary of $61,530, about 22% higher than the salary in the median city. They’ve also had their business buoyed by a 56.7% increase in home values since 2019, the 10th best overall.
Although prices in the typical market are expected to decline by 0.6% over the next year, according to Zillow’s home value forecast, Indianapolis is predicted to continue growing by a modest, but measurable, 0.4%.
Rankings by Category

The 10 Worst Cities for Real Estate Agents
- San Francisco, California
- Austin, Texas
- San Jose, California
- Dallas, Texas
- Milwaukee, Wisconsin
- New Orleans, Louisiana
- Las Vegas, Nevada
- Phoenix, Arizona
- Los Angeles, California
- Riverside, California
They may call it the Golden State, but California is far from golden for Realtors. Four of the country’s 10 worst cities for agents are located there, including the bottom city overall, San Francisco. This is due to a variety of factors, including some of the country’s worst housing affordability based on an agent’s salary, low statewide commission averages, and one of the most extensive education requirements to obtain and keep a license.
Popular Sunbelt cities — such as Las Vegas, Phoenix, Dallas, and Austin — also made the bottom 10. They’re primarily weighed down by a high number of agents per 100,000 residents and related issues with relatively few deals per full-time Realtor.
Worst City: San Francisco, CA
| 💸 California Dreamin’ (of Someday Affordin’ a Home) Although San Francisco agents make a median salary of $65,190 per year – the eighth best in the country — it takes 18.2 years of that salary to afford the median home. That's more than 2x the number of years it takes in the median city (7.7). |
Agents who want to work in this popular, fast-paced market should expect plenty of competition. There are 103.7 full-time real estate agents per 100,000 residents in the area, 63% more than in the median city (63.5).
Those who make it through are rewarded with just a median of 6.8 home sales per year. That’s barely a third of sales in the typical market (18).
As a result, agents have little leverage when setting commission rates. The average listing agent commission in California is 2.69%. That's 5% lower than the median city in our study, where the average listing agent commission is 2.82%. Meanwhile, the average buyer's agent commission in the market is 2.41%, which is 10% lower than the median city, where the average buyer's agent commission is 2.67%.
Overall, the market has underperformed, with just a 23.4% increase in home values since 2019 – barely half what the median market saw (46.7%).
San Francisco agents hoping for better times ahead may be out of luck. The Zillow home value forecast for San Francisco over the next 12 months projects a drop of 3.6% for Bay Area homes, a full 3% lower than the median city in our study.
Average Commission Rates by State
| State | Total Commission | Buyer's Agent Commission | Listing Agent Commission |
| National Average | 5.49% | 2.66% | 2.83% |
| Alabama | 5.45% | 2.70% | 2.75% |
| Alaska | 6.00% | 3.00% | 3.00% |
| Arizona | 5.44% | 2.75% | 2.69% |
| Arkansas | 5.99% | 2.77% | 3.22% |
| California | 5.11% | 2.41% | 2.69% |
| Colorado | 5.63% | 2.83% | 2.80% |
| Connecticut | 5.47% | 2.50% | 2.97% |
| Delaware | 4.88% | 2.44% | 2.44% |
| Florida | 5.37% | 2.55% | 2.82% |
| Georgia | 5.81% | 2.88% | 2.93% |
| Hawaii | 4.78% | 2.33% | 2.45% |
| Idaho | 5.50% | 2.75% | 2.75% |
| Illinois | 5.35% | 2.60% | 2.75% |
| Indiana | 5.56% | 2.82% | 2.73% |
| Iowa | 5.67% | 3.00% | 2.67% |
| Kansas | 5.58% | 2.95% | 2.63% |
| Kentucky | 6.00% | 3.00% | 3.00% |
| Louisiana | 5.56% | 2.67% | 2.89% |
| Maine | 5.17% | 2.33% | 2.83% |
| Maryland | 5.34% | 2.58% | 2.76% |
| Massachusetts | 5.45% | 2.35% | 3.10% |
| Michigan | 5.92% | 2.96% | 2.96% |
| Minnesota | 5.82% | 2.77% | 3.05% |
| Mississippi | 6.07% | 2.79% | 3.29% |
| Missouri | 5.58% | 2.69% | 2.89% |
| Montana | 5.50% | 2.50% | 3.00% |
| Nebraska | 5.25% | 2.50% | 2.75% |
| Nevada | 5.80% | 2.90% | 2.90% |
| New Hampshire | 5.25% | 2.42% | 2.83% |
| New Jersey | 5.21% | 2.22% | 2.99% |
| New Mexico | 5.90% | 2.90% | 3.00% |
| New York | 5.39% | 2.39% | 3.00% |
| North Carolina | 5.52% | 2.63% | 2.88% |
| North Dakota | 5.00% | 2.50% | 2.50% |
| Ohio | 5.99% | 2.91% | 3.08% |
| Oklahoma | 5.95% | 2.90% | 3.05% |
| Oregon | 5.03% | 2.42% | 2.61% |
| Pennsylvania | 5.48% | 2.67% | 2.81% |
| Rhode Island | 5.50% | 2.50% | 3.00% |
| South Carolina | 5.62% | 2.82% | 2.80% |
| South Dakota* | 5.49% | 2.66% | 2.83% |
| Tennessee | 5.58% | 2.82% | 2.77% |
| Texas | 5.73% | 2.87% | 2.86% |
| Utah | 4.90% | 2.60% | 2.30% |
| Vermont* | 5.49% | 2.66% | 2.83% |
| Virginia | 5.45% | 2.73% | 2.72% |
| Washington | 5.26% | 2.51% | 2.75% |
| Washington, D.C.* | 5.49% | 2.66% | 2.83% |
| West Virginia | 6.66% | 3.33% | 3.33% |
| Wisconsin | 5.20% | 2.46% | 2.74% |
| Wyoming | 6.00% | 2.50% | 3.50% |
Methodology
To rank the top 50 metros, we considered the following data points weighted in the following manner:
- Affordability, based on years of median agent salary to afford a typical home (19.2%)
- Annual salary for real estate agents (11.5%)
- Number of agents per 100,000 residents (11.5%)
- Annual home sales per full-time agent (11.5%)
- Days on market (3.8%)
- Listing agent commission rate (3.8%)
- Buyer's agent commission rate (3.8%)
- Listing agent commission on typical home, in dollars (3.8%)
- Buyer's agent commission on typical home, in dollars (3.8%)
- Home value forecast, next 12 months (7.7%)
- Change in home values, last five years (7.7%)
- Real estate license reciprocity (3.8%)
- Hours needed to obtain a license (3.8%)
- Annual hours of continuing education to maintain license (3.8%)
Data sources for this study include Zillow, the Bureau of Labor Statistics, Clever Real Estate, TheClose, Real Estate License Training, VanEd, the U.S. Census, and numerous state real estate commission websites.
About Clever
Since 2017, Clever Real Estate has been on a mission to make selling or buying a home easier and more affordable for everyone. Twelve million annual readers rely on Clever's library of educational content and data-driven research to make smarter real estate decisions — and to date, Clever has helped consumers save more than $82 million on realtor fees. Clever's research has been featured in The New York Times, Business Insider, Inman, Housing Wire, and many more.
More Research from Clever


Articles You May Like


FAQs
Where is the best place to live as a Realtor?
It’s most affordable for real estate agents to live in Buffalo, New York, on their typical salary. Realtors need just 3.1 years of median salary to afford an average home in the market, less than half the time it takes in the median city (7.7 years). Learn more.
Where are real estate agents paid the most?
Real estate agents in the New York and northern New Jersey area have a median salary of $103,960. That's more than double the median city, where real estate agents have a median salary of $50,345. Learn more.
What is the best place to get your real estate license?
Detroit residents need only 40 hours of coursework to become an agent, the lowest requirement of all cities studied and less than half the typical requirement of 90 hours. Detroit also has the fewest real estate agents per 100,000 residents (15.6). Learn more.
Where do real estate agents sell the most homes?
Detroit real estate agents are the busiest of any market in the country, with full-time agents selling an average of 89.1 homes over the past year. That’s nearly 5x the amount in the median city (18). Learn more.