

I built this rental property calculator from real experience — as an investor who has personally evaluated hundreds of deals, managed a portfolio of up to 22 rental units, and licensed real estate agent. These aren't hypothetical numbers. I've run this exact model on real properties, made the mistakes you're trying to avoid, and refined it over five years.
The hard truth about rental property investing is that deals that look good — nice photos, solid neighborhood, reasonable asking price — can quietly bleed money every month if the numbers aren't right. This calculator is designed to surface that before you write a check, not after.
Why you need a rental property calculator
Over the past several years, I’ve grown my real estate portfolio from a small fourplex that I house hacked all the way up to 22 apartments worth over $1.6 million dollars. While growing my portfolio, I’ve looked at hundreds — if not thousands — of deals. One thing became very clear: investing in real estate is a numbers game, and cash flow is king.
You can build a successful portfolio if you’re able to project how a rental property is going to perform and understand exactly how much cashflow you’re going to have after your mortgage and expenses. But that’s very difficult to do without the right tools.
Properties that look nice and seem like they might be a good deal often end up being bad investments that would lose you money every single year if you made the mistake of purchasing them. A great rental property calculator takes the guesswork out of forecasting your cash flow, and makes it much easier to grow a profitable portfolio.
Basic rental property calculator
This basic rental property calculator is a great resource to quickly check if a rental property has the potential to be a good investment. But it’s still missing some important information you’d want if you’re seriously evaluating an investment property for purchase. If you’re interested in taking a deeper dive on a rental property, check out the advanced rental property calculator.
Advanced rental property calculator
I built this more advanced rental property calculator in a spreadsheet that you can make a copy of for yourself. This calculator will show you the following:
- Breakdown of expenses by category
- Purchase and pro forma cap rates
- Income-to-expense ratio (the 1% rule)
- Gross rent multiplier
- Debt-service-coverage ratio
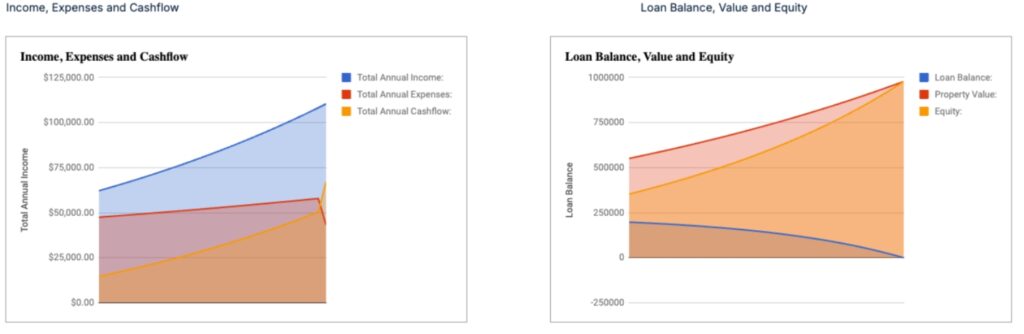
- Charts that show projected income, expenses, and cash flow projections for the next 30 years
- Ability to add in leasing fees
- Ability to add in additional income (laundry, RUBS, etc)
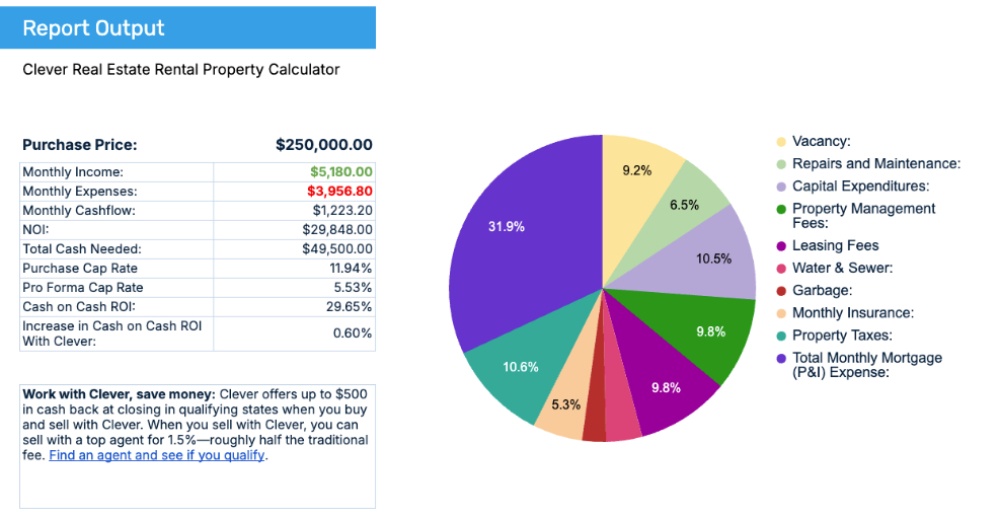
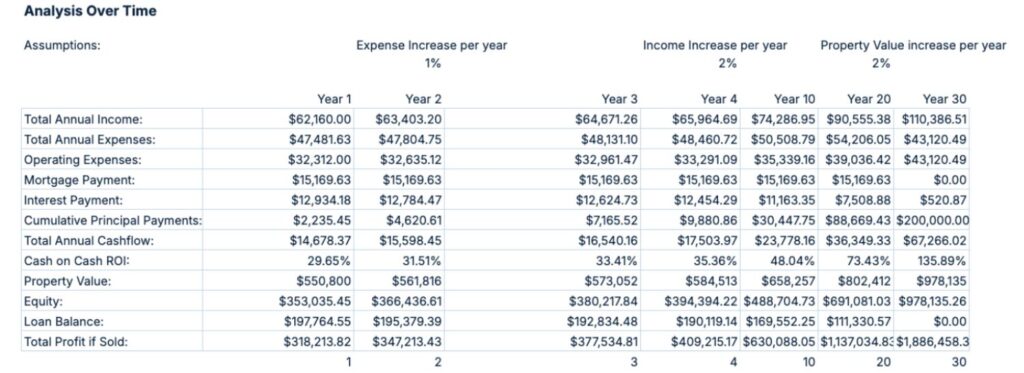
Here is what the output of this tool looks like:
If you’re a new investor and are a bit nervous about making sense of this advanced rental property calculator—don’t worry! I made a video tutorial in which I walk you through exactly how to use this calculator to model a real property and talk through all of the inputs and outputs on the calculator.
In this video, I use the advanced calculator to model a real deal I found on Zillow and talk through how I estimate expenses using just listing photos and decide whether a deal is worth further diligence.
What is a good return for a rental property?
When it comes to investing in real estate, a "good" return can be very different based on each individual investor and their goals. Some investors are looking for cash flow, while others are simply looking to break even on cash flow and make their money through appreciation in value and tax write-offs.
My partner and I invest in the St. Louis market and our strategy is to mostly buy properties on "the fringe" — areas that have good cash flow with a lot of potential for appreciation in the next five or so years.
For these properties we’re aiming for above a 15% cash-on-cash return, and we’re looking for deals that we can refinance and pull out all of our capital once we finish renovations and leasing (the BRRRR Strategy). But there are multiple real estate investing strategies with different “good” returns.
1% rule in real estate investing: does it still apply?
When hunting for deals in nicer areas, I generally look for properties that meet the 1% rule,[1] where monthly rents are 1% or greater than the purchase price of the property and cash-on-cash returns are above 8.5%.
The 1% rule (where monthly rent equals at least 1% of the purchase price) made more sense when rates were nearer zero and prices were lower. Today, it's a tougher benchmark to hit in most markets. According to ATTOM's Q1 2025 Single-Family Rental Market Report, the average gross rental yield on three-bedroom properties across 361 U.S. counties is projected at 7.45% in 2025, down slightly from 7.52% in 2024.[2] That's before expenses, vacancies, and financing costs are factored in.
In practice, in most mid-tier markets, you're looking for a 1.2%–1.5% rent-to-price ratio to generate meaningful cash flow after a conventional mortgage. In lower-priced markets (sub-$100K properties), you may need to push toward 2%+ because maintenance costs represent a higher percentage of rent. In appreciating urban markets, you may break even or even cash flow slightly negative — and make your money through appreciation and forced equity. Know which strategy you're running before you set a target.
Cash-on-cash return vs. capitalization rate
Real estate investors will often debate which metric is more important: cash-on-cash return or cap rate. They are both very important, but for different reasons. Depending on the goals for your investment, one metric will be more important than the other.
Cash-on-cash return is a great metric for investors that are looking for cash flow, as it’s easy to understand that a 20% cash-on-cash return of a $100,000 investment yields $20,000 per year.
It’s also easy to compare to the stock market, although this can be a bit misleading. Real estate income is generally tax advantaged compared to dividends earned in the stock market. And comparing cash-on-cash returns to the stock market doesn’t take appreciation into account, where you can leverage the value of the asset in real estate.
However, more experienced investors often focus on cap rate, as it allows them to make a larger amount of money faster. One simple way to think about cap rate is the amount an investor will pay today for a future revenue stream. You can use our cap rate calculator to get an idea of what this looks like for your property.
If you buy a property that trades at an 8% cap rate and then raise the net operating income of the property by $5,000, you can divide that by the 8% cap rate. You’ve just generated $62,500 in value!
Good investors that are able to increase net operating income (NOI) are often able to achieve several years of cash flow in value created through forced appreciation.
Personally, I look for properties that have cash flow when I buy them but also have tons of room to increase income, so I can benefit from forced appreciation and capture that equity through a refinance in the future.
How to accurately predict rental property expenses
One of the most common mistakes new investors make is not accurately modeling expenses for their rental properties. I think a lot of this comes from some of the advice out there that recommends simply modeling certain percentages of rent for repairs and capital expenditures.
This is an incredibly dangerous way to model your rental properties and will almost always be wrong.
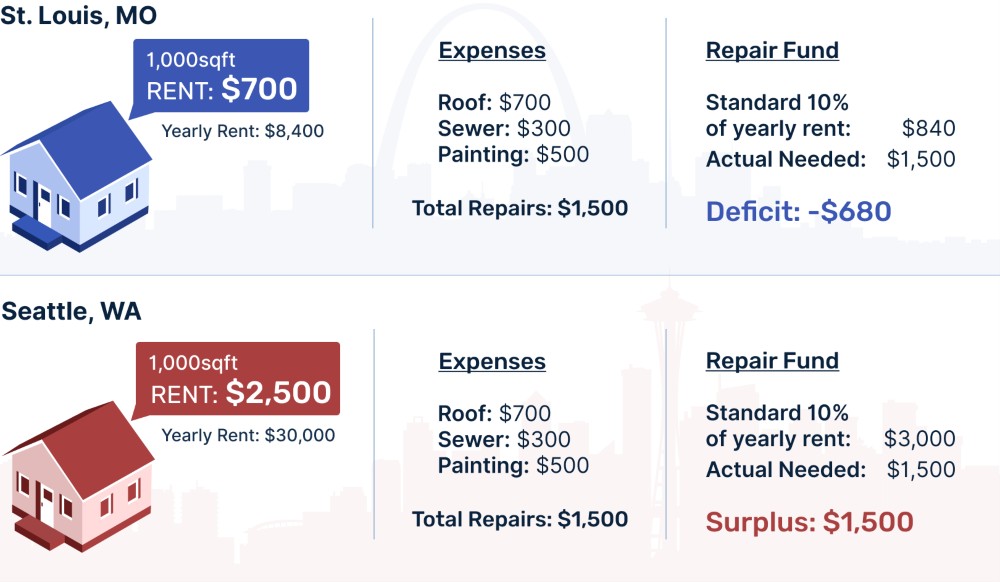
For example, a 1,000-square-foot house in Seattle and a 1,000-square-foot house in St. Louis are going to have similar expenses for maintenance (roof, sewer, painting, etc), but drastically different rents.
One property might rent for $2,500 and the other for only $700. If we were to do a "standard" 10% of rent for repairs, our Seattle house would have a yearly escrow of $3,000 for repairs and our St. Louis house would only have $840 set aside for repairs.
With this in mind, one of the most important things you need to learn to use this model successfully is how to accurately predict expenses. When I was a new investor, this was one of the hardest things for me to learn.
With time, you will be able to look at pictures of a listing online and analyze the condition of a property, along with what repairs it will likely need in the future — and add that into the model.
Real estate investing lessons I’ve learned over the years
After doing this for several years now, the biggest learning I’ve had by far is that being a landlord is extremely difficult when you have any type of stressful job. My cofounder and I have lost thousands and thousands of dollars on expensive property managers who ended up doing a bad job or by not being involved enough on renovation work or other long-term investment property decisions due to the demands of running a startup.
I remained convinced that real estate might be the most predictable and safe path to financial freedom, but it’s definitely not easy. That said, safe is a relative term—you still need to be eyes open that tons of investment properties get foreclosed on too. And in this high rate environment, you need to be more sure than ever.
The saying “you make money when you buy” rings even more true to me now than it did before. We’ve sold off a lot of our properties over the past couple of years, but one of the few buildings we still own was one we bought in a package of other buildings that we thought was mispriced, with an allocated cost of $146k. But I’m pretty sure it was worth closer to $250k the day we closed. If we did even a minor renovation on this building, rents would be as high as $2,800 for the building, making it a lot harder to lose and always giving us a path out to profitability.
The inverse of this is scary and worth hammering home—better to buy nothing and sit on cash than buy a bad deal. Sometimes you just can’t work your way out of a bad deal. (Exhibit A: There are lots of commercial landlords currently giving their keys back to the bank because they have negative equity.)
But when you find a good deal on a rental property and you have the finances to back it up, it’s an almost unbeatable way to build wealth, save on taxes, and hedge against inflation.
If you’re looking to sell or buy a rental property, I recommend working with my company Clever Real Estate. When you work with Clever, you can sell with a top agent for just 1.5% — that’s half the traditional fee. Qualifying buyers can get cash back when they buy with Clever. Take a short quiz to get started.
Key rental property terms to know
| Term | Definition |
|---|---|
| Cap Rate | Capitalization rate, or cap rate for short, is the annual yield of a property - What percentage of the purchase price would it return every year if you purchased it in cash |
| Net Operating Income (NOI) | How much income does the property generate after all non mortgage expenses |
| Debt Service Coverage Ratio | How much free cash is available to pay debt obligations. |
| Gross Rent Multiplier (GRM) | Gross Rent Multiplier is the number of years it takes for a property's gross rents to equal the purchase price. |
| Amortization Term | The total length of time it takes to payoff a loan |
| Vacancy Rate | What percentage of the time is your property vacant |