

If you're selling a home, you've probably heard that the NAR lawsuit was supposed to make real estate commissions cheaper. Two years after the settlement's rules took effect, that hasn't happened for most sellers.
Since the NAR settlement took effect in August 2024, average total commissions have risen in 36 states and fallen in 13. Nationally, sellers now pay an average of 5.46% in total commission, up from 5.32% in 2024.[1]
What changed was the process: Buyers now sign a written agreement with their agent before touring homes, and sellers can no longer advertise what they'll pay the buyer's agent on the MLS. In August 2026, a federal appeals court upheld the settlement, which ends the main real estate commission lawsuit.
Learn more about the NAR lawsuit, where commission rates stand in your state, what agents say has and hasn't changed, and how sellers are still paying less.
📝 NAR settlement: Key takeaways
Commissions haven't fallen. The national average total commission is 5.46% in 2026, compared with 5.32% in 2024 and 5.49% in 2023. Buyer's agent fees rose from 2.58% to 2.70%.
Sellers still pay the buyer's agent most of the time. The offer just isn't posted on the MLS anymore. 73% of agents say sellers in their market are likely to cover the buyer's agent commission.[1]
Buyers sign an agreement before touring. The agency agreement spells out what the buyer's agent is paid and who pays it if the seller won't.
The settlement has been upheld, and the claim deadline has passed. An appeals court upheld it on August 19, 2026. Home sellers who filed by May 9, 2025, will be paid once appeals end. Homebuyers have a separate settlement, with claims due by October 27, 2026.[2]
What was the NAR lawsuit about?
The NAR lawsuit was a class-action antitrust case brought by home sellers. They argued that the National Association of Realtors' rules forced them to pay the buyer's agent and kept commissions high. Under the old system, the seller's listing agreement set the buyer's agent's pay, and that offer appeared in the MLS for every agent to see.
In the best-known case, Sitzer/Burnett v. NAR, a Kansas City jury found NAR and several large brokerages liable on October 31, 2023, and awarded home sellers $1.78 billion in damages.[3] Antitrust damages can be tripled, which could have pushed the total past $5 billion. NAR settled less than five months later.
In March 2024, NAR agreed to pay $418 million over about four years and change two rules: offers of buyer's agent pay came off the MLS, and buyers had to sign a written agreement with their agent.[4]
NAR lawsuit timeline: 2023 to 2026
| Date | What happened |
|---|---|
| Oct. 31, 2023 | A jury in Sitzer/Burnett awards home sellers $1.78 billion |
| March 15, 2024 | NAR announces its $418 million settlement |
| Aug. 17, 2024 | New rules take effect: no buyer's agent pay offers on the MLS, and written buyer agreements are required |
| Nov. 27, 2024 | The court grants final approval of the NAR settlement |
| May 9, 2025 | Deadline for home sellers to file a claim for the main settlements |
| May 26, 2026 | The court preliminarily approves a $120.3 million homebuyer settlement (Tuccori) |
| Aug. 19, 2026 | The 8th Circuit Court of Appeals upholds the NAR settlement |
| Sept. 24, 2026 | The 8th Circuit denies the objectors' requests for a rehearing |
| Oct. 27, 2026 | Deadline for homebuyers to file a Tuccori claim Upcoming |
| Nov. 2, 2026 | Final approval hearing for the homebuyer settlement Upcoming |
Commission rates haven't moved much
- National average
View chart data
| Year | Total | Listing | Buyer |
|---|---|---|---|
| 2023 | 5.49% | 2.83% | 2.66% |
| 2024 | 5.32% | 2.74% | 2.58% |
| 2025 | 5.57% | 2.82% | 2.75% |
| 2026 | 5.46% | 2.76% | 2.70% |
We gather our commission rate data from a semi-annual survey of our partner agents and other real estate agents. The survey asks about standard local rates for both listing and buying agents.
Two years in, the NAR settlement hasn't lowered what sellers pay. The national average total commission was 5.32% in 2024 and it's 5.46% in 2026. Buyer's agent fees rose from 2.58% to 2.70%, while listing fees rose from 2.74% to 2.76%.[1]
That's not what most people expected in 2024. Clever CEO Luke Babich predicted at the time that buyer's agent fees would fall to 1.5% to 2%, bringing the national average total to about 4.5%. Buyer's agent fees are 2.70% today. Most agents were less surprised. In our 2024 survey, 54% expected buyer's agent rates to stay about the same.[5]
"Little has changed since the commission fee settlement. Most home sellers are agreeing to a commission fee between 2% and 3%," says Chuck Vander Stelt, a real estate broker with Quadwalls Real Estate in Valparaiso, IN. "Instead of dancing the tango, we now dance the foxtrot."
Michael Perna, who leads The Perna Team in Metro Detroit, sees the same pattern. "Since the 2024 NAR settlement went into effect we've seen little change in the way commission works in Metro Detroit," Perna says. "Sellers are consistently offering 2.5 to 3% right now."
In our August 2026 survey, only 28% of agents said commissions in their market have compressed since the settlement.[1]
Average commission rates by state since the NAR settlement
| Fell the most since 2024Your state | 2024 average | 2026 average | ||
|---|---|---|---|---|
| New York | 5.36% | 4.62% | −0.74 pts | Listing and buyer rates for New York |
| ||||
| Connecticut (shared regional sample) | 5.25% | 5.03% | −0.22 pts | Listing and buyer rates for Connecticut |
| ||||
| Maine (shared regional sample) | 5.25% | 5.03% | −0.22 pts | Listing and buyer rates for Maine |
| ||||
| New Hampshire (shared regional sample) | 5.25% | 5.03% | −0.22 pts | Listing and buyer rates for New Hampshire |
| ||||
| Rhode Island (shared regional sample) | 5.25% | 5.03% | −0.22 pts | Listing and buyer rates for Rhode Island |
| ||||
| Vermont (shared regional sample) | 5.25% | 5.03% | −0.22 pts | Listing and buyer rates for Vermont |
| ||||
| Illinois | 5.07% | 4.90% | −0.17 pts | Listing and buyer rates for Illinois |
| ||||
| Wisconsin | 5.78% | 5.61% | −0.17 pts | Listing and buyer rates for Wisconsin |
| ||||
| Texas | 5.77% | 5.61% | −0.16 pts | Listing and buyer rates for Texas |
| ||||
| Missouri | 5.72% | 5.61% | −0.11 pts | Listing and buyer rates for Missouri |
| ||||
| New Mexico (shared regional sample) | 5.68% | 5.62% | −0.06 pts | Listing and buyer rates for New Mexico |
| ||||
| Oklahoma (shared regional sample) | 5.68% | 5.62% | −0.06 pts | Listing and buyer rates for Oklahoma |
| ||||
| Minnesota | 5.76% | 5.74% | −0.02 pts | Listing and buyer rates for Minnesota |
| ||||
| New Jersey | 5.06% | 5.07% | +0.01 pts | Listing and buyer rates for New Jersey |
| ||||
| Michigan | 5.86% | 5.91% | +0.05 pts | Listing and buyer rates for Michigan |
| ||||
| Ohio | 5.60% | 5.65% | +0.05 pts | Listing and buyer rates for Ohio |
| ||||
| Tennessee | 5.54% | 5.59% | +0.05 pts | Listing and buyer rates for Tennessee |
| ||||
| Washington | 5.17% | 5.22% | +0.05 pts | Listing and buyer rates for Washington |
| ||||
| California | 4.99% | 5.08% | +0.09 pts | Listing and buyer rates for California |
| ||||
| Iowa (shared regional sample) | 5.51% | 5.61% | +0.10 pts | Listing and buyer rates for Iowa |
| ||||
| Kansas (shared regional sample) | 5.51% | 5.61% | +0.10 pts | Listing and buyer rates for Kansas |
| ||||
| Nebraska (shared regional sample) | 5.51% | 5.61% | +0.10 pts | Listing and buyer rates for Nebraska |
| ||||
| North Dakota (shared regional sample) | 5.51% | 5.61% | +0.10 pts | Listing and buyer rates for North Dakota |
| ||||
| South Dakota (shared regional sample) | 5.51% | 5.61% | +0.10 pts | Listing and buyer rates for South Dakota |
| ||||
| Georgia | 5.62% | 5.74% | +0.12 pts | Listing and buyer rates for Georgia |
| ||||
| North Carolina | 5.47% | 5.59% | +0.12 pts | Listing and buyer rates for North Carolina |
| ||||
| Alaska (shared regional sample) | 5.04% | 5.22% | +0.18 pts | Listing and buyer rates for Alaska |
| ||||
| Colorado | 5.29% | 5.47% | +0.18 pts | Listing and buyer rates for Colorado |
| ||||
| Hawaii (shared regional sample) | 5.04% | 5.22% | +0.18 pts | Listing and buyer rates for Hawaii |
| ||||
| Oregon | 5.00% | 5.22% | +0.22 pts | Listing and buyer rates for Oregon |
| ||||
| South Carolina | 5.36% | 5.59% | +0.23 pts | Listing and buyer rates for South Carolina |
| ||||
| Florida | 5.04% | 5.29% | +0.25 pts | Listing and buyer rates for Florida |
| ||||
| Indiana | 5.30% | 5.57% | +0.27 pts | Listing and buyer rates for Indiana |
| ||||
| Alabama | 5.31% | 5.59% | +0.28 pts | Listing and buyer rates for Alabama |
| ||||
| Arkansas (shared regional sample) | 5.30% | 5.59% | +0.29 pts | Listing and buyer rates for Arkansas |
| ||||
| Delaware (shared regional sample) | 5.30% | 5.59% | +0.29 pts | Listing and buyer rates for Delaware |
| ||||
| Kentucky (shared regional sample) | 5.30% | 5.59% | +0.29 pts | Listing and buyer rates for Kentucky |
| ||||
| Louisiana (shared regional sample) | 5.30% | 5.59% | +0.29 pts | Listing and buyer rates for Louisiana |
| ||||
| Mississippi (shared regional sample) | 5.30% | 5.59% | +0.29 pts | Listing and buyer rates for Mississippi |
| ||||
| West Virginia (shared regional sample) | 5.30% | 5.59% | +0.29 pts | Listing and buyer rates for West Virginia |
| ||||
| Arizona | 5.40% | 5.71% | +0.31 pts | Listing and buyer rates for Arizona |
| ||||
| Pennsylvania | 5.35% | 5.71% | +0.36 pts | Listing and buyer rates for Pennsylvania |
| ||||
| Maryland | 5.30% | 5.69% | +0.39 pts | Listing and buyer rates for Maryland |
| ||||
| Massachusetts | 4.47% | 5.03% | +0.56 pts | Listing and buyer rates for Massachusetts |
| ||||
| Idaho (shared regional sample) | 4.69% | 5.47% | +0.78 pts | Listing and buyer rates for Idaho |
| ||||
| Montana (shared regional sample) | 4.69% | 5.47% | +0.78 pts | Listing and buyer rates for Montana |
| ||||
| Utah (shared regional sample) | 4.69% | 5.47% | +0.78 pts | Listing and buyer rates for Utah |
| ||||
| Wyoming (shared regional sample) | 4.69% | 5.47% | +0.78 pts | Listing and buyer rates for Wyoming |
| ||||
| Virginia | 5.19% | 6.00% | +0.81 pts | Listing and buyer rates for Virginia |
| ||||
| Nevada (small 2024 sample) | 3.51% | 5.47% | +1.96 pts | Listing and buyer rates for Nevada |
| ||||
| Rose the most since 2024Your state | 2024 average | 2026 average | ||
|---|---|---|---|---|
| Nevada (small 2024 sample) | 3.51% | 5.47% | +1.96 pts | Listing and buyer rates for Nevada |
| ||||
| Virginia | 5.19% | 6.00% | +0.81 pts | Listing and buyer rates for Virginia |
| ||||
| Idaho (shared regional sample) | 4.69% | 5.47% | +0.78 pts | Listing and buyer rates for Idaho |
| ||||
| Montana (shared regional sample) | 4.69% | 5.47% | +0.78 pts | Listing and buyer rates for Montana |
| ||||
| Utah (shared regional sample) | 4.69% | 5.47% | +0.78 pts | Listing and buyer rates for Utah |
| ||||
| Wyoming (shared regional sample) | 4.69% | 5.47% | +0.78 pts | Listing and buyer rates for Wyoming |
| ||||
| Massachusetts | 4.47% | 5.03% | +0.56 pts | Listing and buyer rates for Massachusetts |
| ||||
| Maryland | 5.30% | 5.69% | +0.39 pts | Listing and buyer rates for Maryland |
| ||||
| Pennsylvania | 5.35% | 5.71% | +0.36 pts | Listing and buyer rates for Pennsylvania |
| ||||
| Arizona | 5.40% | 5.71% | +0.31 pts | Listing and buyer rates for Arizona |
| ||||
| Arkansas (shared regional sample) | 5.30% | 5.59% | +0.29 pts | Listing and buyer rates for Arkansas |
| ||||
| Delaware (shared regional sample) | 5.30% | 5.59% | +0.29 pts | Listing and buyer rates for Delaware |
| ||||
| Kentucky (shared regional sample) | 5.30% | 5.59% | +0.29 pts | Listing and buyer rates for Kentucky |
| ||||
| Louisiana (shared regional sample) | 5.30% | 5.59% | +0.29 pts | Listing and buyer rates for Louisiana |
| ||||
| Mississippi (shared regional sample) | 5.30% | 5.59% | +0.29 pts | Listing and buyer rates for Mississippi |
| ||||
| West Virginia (shared regional sample) | 5.30% | 5.59% | +0.29 pts | Listing and buyer rates for West Virginia |
| ||||
| Alabama | 5.31% | 5.59% | +0.28 pts | Listing and buyer rates for Alabama |
| ||||
| Indiana | 5.30% | 5.57% | +0.27 pts | Listing and buyer rates for Indiana |
| ||||
| Florida | 5.04% | 5.29% | +0.25 pts | Listing and buyer rates for Florida |
| ||||
| South Carolina | 5.36% | 5.59% | +0.23 pts | Listing and buyer rates for South Carolina |
| ||||
| Oregon | 5.00% | 5.22% | +0.22 pts | Listing and buyer rates for Oregon |
| ||||
| Alaska (shared regional sample) | 5.04% | 5.22% | +0.18 pts | Listing and buyer rates for Alaska |
| ||||
| Colorado | 5.29% | 5.47% | +0.18 pts | Listing and buyer rates for Colorado |
| ||||
| Hawaii (shared regional sample) | 5.04% | 5.22% | +0.18 pts | Listing and buyer rates for Hawaii |
| ||||
| Georgia | 5.62% | 5.74% | +0.12 pts | Listing and buyer rates for Georgia |
| ||||
| North Carolina | 5.47% | 5.59% | +0.12 pts | Listing and buyer rates for North Carolina |
| ||||
| Iowa (shared regional sample) | 5.51% | 5.61% | +0.10 pts | Listing and buyer rates for Iowa |
| ||||
| Kansas (shared regional sample) | 5.51% | 5.61% | +0.10 pts | Listing and buyer rates for Kansas |
| ||||
| Nebraska (shared regional sample) | 5.51% | 5.61% | +0.10 pts | Listing and buyer rates for Nebraska |
| ||||
| North Dakota (shared regional sample) | 5.51% | 5.61% | +0.10 pts | Listing and buyer rates for North Dakota |
| ||||
| South Dakota (shared regional sample) | 5.51% | 5.61% | +0.10 pts | Listing and buyer rates for South Dakota |
| ||||
| California | 4.99% | 5.08% | +0.09 pts | Listing and buyer rates for California |
| ||||
| Michigan | 5.86% | 5.91% | +0.05 pts | Listing and buyer rates for Michigan |
| ||||
| Ohio | 5.60% | 5.65% | +0.05 pts | Listing and buyer rates for Ohio |
| ||||
| Tennessee | 5.54% | 5.59% | +0.05 pts | Listing and buyer rates for Tennessee |
| ||||
| Washington | 5.17% | 5.22% | +0.05 pts | Listing and buyer rates for Washington |
| ||||
| New Jersey | 5.06% | 5.07% | +0.01 pts | Listing and buyer rates for New Jersey |
| ||||
| Minnesota | 5.76% | 5.74% | −0.02 pts | Listing and buyer rates for Minnesota |
| ||||
| New Mexico (shared regional sample) | 5.68% | 5.62% | −0.06 pts | Listing and buyer rates for New Mexico |
| ||||
| Oklahoma (shared regional sample) | 5.68% | 5.62% | −0.06 pts | Listing and buyer rates for Oklahoma |
| ||||
| Missouri | 5.72% | 5.61% | −0.11 pts | Listing and buyer rates for Missouri |
| ||||
| Texas | 5.77% | 5.61% | −0.16 pts | Listing and buyer rates for Texas |
| ||||
| Illinois | 5.07% | 4.90% | −0.17 pts | Listing and buyer rates for Illinois |
| ||||
| Wisconsin | 5.78% | 5.61% | −0.17 pts | Listing and buyer rates for Wisconsin |
| ||||
| Connecticut (shared regional sample) | 5.25% | 5.03% | −0.22 pts | Listing and buyer rates for Connecticut |
| ||||
| Maine (shared regional sample) | 5.25% | 5.03% | −0.22 pts | Listing and buyer rates for Maine |
| ||||
| New Hampshire (shared regional sample) | 5.25% | 5.03% | −0.22 pts | Listing and buyer rates for New Hampshire |
| ||||
| Rhode Island (shared regional sample) | 5.25% | 5.03% | −0.22 pts | Listing and buyer rates for Rhode Island |
| ||||
| Vermont (shared regional sample) | 5.25% | 5.03% | −0.22 pts | Listing and buyer rates for Vermont |
| ||||
| New York | 5.36% | 4.62% | −0.74 pts | Listing and buyer rates for New York |
| ||||
*These states share a regional sample in our agent survey, so their figures are identical. †Nevada's 2024 figure comes from a small sample, so its change may be overstated. Rates are from Clever's semi-annual agent surveys; 2026 figures are from our August 2026 survey of 434 agents.
Since the NAR settlement took effect in August 2024, average total commissions have risen in 36 states and fallen in 13. New York had the biggest drop since 2024, from 5.36% to 4.62%. Virginia had the largest increase, from 5.19% to 6.00%, and it's now the only state where agents report the full traditional 6%. Look up your state before you interview agents.
What changed for buyers
Buyers now sign a written agreement with their agent before touring a home. The agreement says how much the agent is paid (a percentage, a flat fee, or a retainer) and makes the buyer responsible for any amount the seller doesn't cover.
In practice, sellers still pay the buyer's agent in most deals. 46% of agents in our August 2026 survey said sellers in their market still commonly offer to pay the buyer's agent, and 73% said sellers are likely to offer to cover that commission.[1]
The difference is that the payment is now negotiated in your offer and isn't posted in the listing.
Ashley Oshinsky, broker and owner of Higher Living Real Estate in Metro Detroit, says how much the seller pays depends on the offer. "If the offer is strong, they'll usually still honor the buyer agent commission. If it's weak, that's the first thing they push back on," she says. "The compensation is tied to the strength of the deal now."
The risk for buyers is the gap between what you agreed to pay your agent and what the seller will cover. "My buyers signed at 3%, and when we wrote the offer, the seller wouldn't go above 2% on the buyer side," Oshinsky says. On a $400,000 home, a 1-point gap is $4,000; the buyer either pays at closing or negotiates away.
Before you sign, ask your agent: "If the seller only covers part of your fee, will you accept that amount, or will I owe the difference?" Some agents will flex. Vander Stelt recently cut a buyer's fee from 3% to 1.74% to save a deal. "I was comfortable doing it because this buyer only needed to go out and see homes twice," he says.
Buyer's agency agreement example
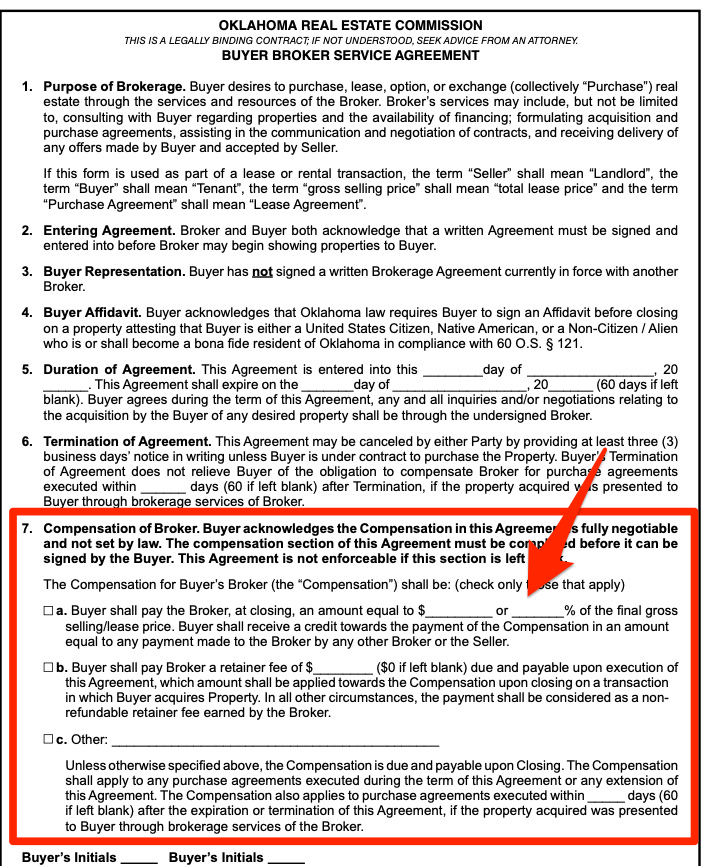
Here’s what a buyer’s broker service agreement looks like in Oklahoma.
In this agreement, signed before touring homes, the buyer commits to paying a specified dollar amount, commission percentage, or a retainer fee to the buyer’s agent, upon closing a home purchase (see section 7 above).
However, remember that commissions remain fully negotiable.
💸 How buyers pay their agent today
Here are three outcomes for how commissions might get paid:
- The seller pays it. This is still the most common outcome. You ask for it in your offer.
- The seller gives a credit or a lower price. The credit goes toward your closing costs, including your agent's fee.
- You pay the difference. If the seller covers less than your agreement says, you pay the rest at closing. Some lenders let you roll it into the loan, so check with yours before you make an offer.
What sellers need to know about commission changes
Your listing agreement no longer sets what the buyer's agent is paid, and the MLS listing doesn't show it. Before August 2024, Charleston, SC, listing agreements like the one below included a percentage for "compensation to other brokerages," and that number appeared in the MLS. That field is gone.
📄 Prior listing agreement example
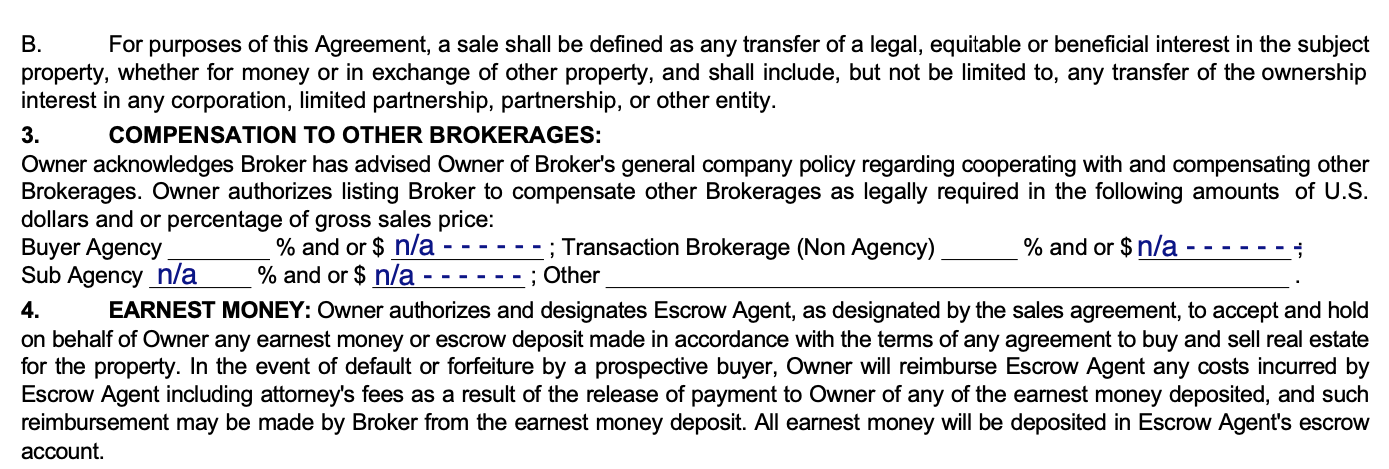
You can still offer to pay the buyer's agent. You just do it in the offer negotiation, or say it up front through your agent. Most sellers still pay. "I haven't had a sale since the settlement where we didn't agree to have the seller cover the compensation, at least most of it," says Christina Rordam, a Realtor with Florida Realty Investments in Orlando. "It's just become part of the offer."
You don't have to say yes to every request, though. Rene Perez Jr., managing broker of ContextRE in the San Francisco Bay Area, represented sellers of a $4.38 million San Jose home this year. The buyer's agent asked for 3%, or $131,000.
"After an extended back and forth, I negotiated and convinced the sellers (my clients) to counter at 2% commission," Perez says. That's still $87,000, but it kept $44,000 in the sellers' pocket.
How much room you have depends on your market. "If it makes sense to give a credit or concession because the home isn't receiving multiple offers, then sure, let's offer to pay the buyer broker fee," Perez says. "But if the home has 10 offers, then why commit to a concession?"
How to save on commission after the NAR lawsuit
If you were waiting for the NAR lawsuit to bring commissions down, it hasn't. Sellers pay about the same 5% to 6% total they paid before the settlement. Lower rates are available if you ask for them: 42% of agents told us they're more open to negotiating realtor fees than they were before the settlement.[1]
Ask for a lower listing fee, get a second quote, and decide early whether you'll offer to cover the buyer's agent. Our guide to saving on realtor fees covers five ways to pay less, with dollar examples for each.
The simplest option is a lower rate from the start. Clever's partner agents charge listing fees as low as 1.5%, compared with the national average of 2.76% for listing agents. They're full-service agents from brokerages like Keller Williams and RE/MAX. On a $400,000 home, a 1.5% listing fee instead of 2.76% saves you $5,040.
If you're buying, ask your agent before you sign the buyer agreement whether they'll accept whatever the seller offers. If they won't, you could owe the difference at closing. Home rebate programs can return part of your agent's fee to you.
Related reading