

Best college towns, ranked | Affordability | Quality of life | Education | Methodology

|
🔎What is the best college town in America?
America's best college town is Stanford, Calif., followed by Williamsburg, Va. and Pasadena, Calif.
|
With many college back to campus this fall, they are navigating a second year of pandemic measures. For many, proof of vaccination and a negative COVID test are now as commonplace as shower caddies and mini fridges.
[1]Though college students face relatively low risk of serious illness and death, college towns experienced the ripple effects of their return to campus last year.[2] Now, with the Delta variant wreaking havoc across the nation, health officials warn another fall surge may be on the way.[3]
Yet even as 10% of colleges transition to fully online learning,
[4]college towns still hold a nostalgic place in American culture. To rank America's 150 best college towns, we awarded points based on three criteria:
- Affordability: Rent for a one bedroom apartment (-4x), net cost (-4x), median student loan debt (-3x)
- Social life and culture: Walk score (4x), bike score (3x), entertainment options per 100,000 residents (2.5x), restaurants per 100,000 residents (2.5x), Power 5 (2x), student to population ratio (2x)
- College quality: Graduation rate (2x), retention rate (2.5x), median pay after ten years (2x), spending per student (1.5x), median number of undergraduates (1.5x), admission rate (-1x)
Read on to see our full rankings of the best college towns in America — plus, individual rankings for the best and worst college towns by affordability,
quality of life, and education.
America's 150 Best College Towns (2021 Ranking)
| Ranking | City | Colleges |
|---|---|---|
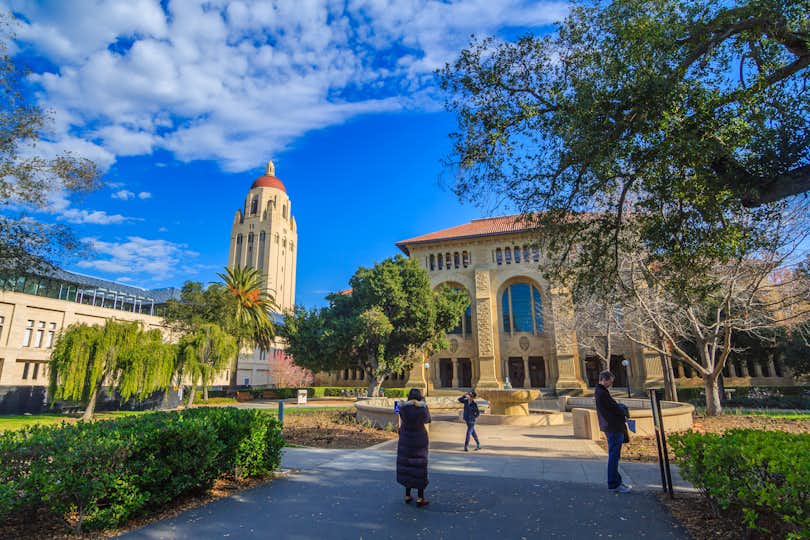
| 1 | Stanford, Calif. | Stanford University |
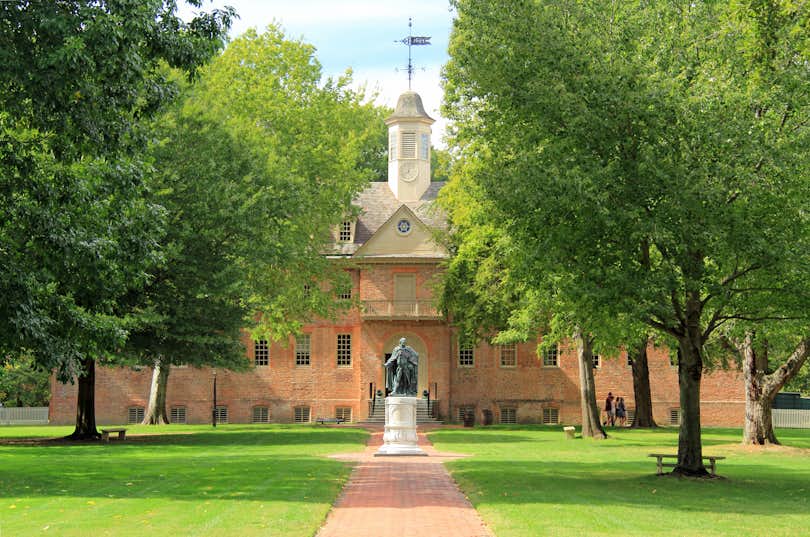
| 2 | Williamsburg, Va. | William & Mary |
| 3 | Pasadena, Calif. | California Institute of Technology |
| 4 | Princeton, N.J. | Princeton University |
| 5 | Charlottesville, Va. | University of Virginia |
| 6 | Ann Arbor, Mich. | University of Michigan-Ann Arbor |
| 7 | Cambridge, Mass. | Harvard University, Massachusetts Institute of Technology, Lesley University |
| 8 | Berkeley, Calif. | University of California-Berkeley |
| 9 | Champaign, Ill. | University of Illinois Urbana-Champaign |
| 10 | Gainesville, Fla. | University of Florida, Santa Fe College |
| 11 | West Lafayette, Ind. | Purdue University |
| 12 | Morgantown, W.Va. | West Virginia University |
| 13 | Chapel Hill, N.C. | University of North Carolina at Chapel Hill |
| 14 | Evanston, Ill. | Northwestern University |
| 15 | Fairfax, Va. | George Mason University |
| 16 | University Park, Pa. | Pennsylvania State University |
| 17 | Oxford, Miss. | University of Mississippi |
| 18 | East Lansing, Mich. | Michigan State University |
| 19 | Davis, Calif. | University of California-Davis |
| 20 | College Station, Texas | Texas A & M University-College Station |
| 21 | Shepherdstown, W.Va. | Shepherd University |
| 22 | Boulder, Colo. | University of Colorado Boulder |
| 23 | Ithaca, N.Y. | Ithaca College, Cornell University |
| 24 | Athens, Ga. | University of Georgia |
| 25 | Eugene, Ore. | University of Oregon |
| 26 | Los Angeles, Calif. | University of California-Los Angeles, University of Southern California, Occidental College, Loyola Marymount University, California State University-Los Angeles, Mount Saint Mary's University |
| 27 | Iowa City, Iowa | University of Iowa |
| 28 | Newark, Del. | University of Delaware |
| 29 | Madison, Wis. | Edgewood College, University of Wisconsin-Madison, Herzing University-Madison |
| 30 | College Park, Md. | University of Maryland-College Park |
| 31 | Stillwater, Okla. | Oklahoma State University |
| 32 | Tallahassee, Fla. | Florida State University, Florida Agricultural and Mechanical University |
| 33 | Bloomington, Ind. | Indiana University-Bloomington |
| 34 | Columbia, Mo. | University of Missouri-Columbia, Columbia College, Stephens College |
| 35 | Blacksburg, Va. | Virginia Polytechnic Institute and State University |
| 36 | Rolla, Mo. | Missouri University of Science and Technology |
| 37 | Provo, Utah | Brigham Young University |
| 38 | La Jolla, Calif. | University of California-San Diego, National University |
| 39 | Minneapolis, Minn. | Dunwoody College of Technology, University of Minnesota-Twin Cities, Augsburg University |
| 40 | Tucson, Ariz. | University of Arizona |
| 41 | Notre Dame, Ind. | University of Notre Dame, Saint Mary's College |
| 42 | Norman, Okla. | University of Oklahoma-Norman Campus |
| 43 | New Brunswick, N.J. | Rutgers University-New Brunswick |
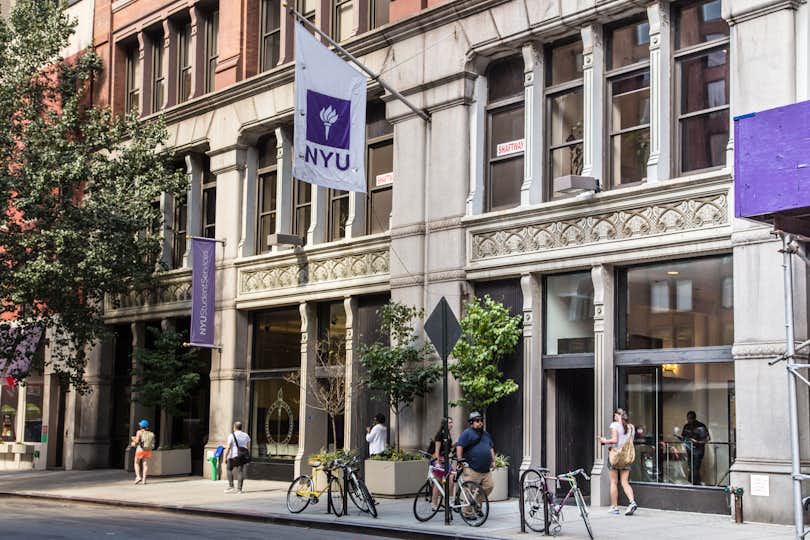
| 44 | Baton Rouge, La. | Louisiana State University, Southern University and A & M College |
| 45 | Clemson, S.C. | Clemson University |
| 46 | Lexington, Va. | Washington and Lee University, Virginia Military Institute |
| 47 | Columbia, S.C. | University of South Carolina-Columbia, Benedict College, Columbia College |
| 48 | Lexington, Ky. | University of Kentucky |
| 49 | Ames, Iowa | Iowa State University |
| 50 | Golden, Colo. | Colorado School of Mines |
| 51 | Seattle, Wash. | Seattle University, University of Washington-Seattle Campus, Seattle Pacific University, City University of Seattle, Seattle Central College, North Seattle College, South Seattle College |
| 52 | Fayetteville, Ark. | University of Arkansas |
| 53 | Pittsburgh, Pa. | University of Pittsburgh, Chatham University, Carnegie Mellon University, Duquesne University, Point Park University, La Roche University, Carlow University |
| 54 | Fredericksburg, Va. | University of Mary Washington |
| 55 | Chico, Calif. | California State University-Chico |
| 56 | West Chester, Pa. | West Chester University of Pennsylvania |
| 57 | Northridge, Calif. | California State University-Northridge |
| 58 | Tuscaloosa, Ala. | The University of Alabama |
| 59 | Fort Collins, Colo. | Colorado State University |
| 60 | Manhattan, N.Y. | Columbia University, New York University, Barnard College, CUNY John Jay College of Criminal Justice, CUNY City College, Marymount Manhattan College, Nyack College, CUNY Hunter College, CUNY Bernard M Baruch College, Touro College, Fashion Institute of Technology, The New School, Yeshiva University, Pace University, Metropolitan College of New York, CUNY Graduate School and University Center |
| 61 | Atlanta, Ga. | Emory University, Georgia Institute of Technology, Spelman College, Morehouse College, Atlanta Metropolitan State College, Oglethorpe University, Clark Atlanta University, Georgia State University, American InterContinental University-Atlanta |
| 62 | Laramie, Wyo. | University of Wyoming |
| 63 | New Haven, Conn. | Yale University, Albertus Magnus College, Southern Connecticut State University |
| 64 | La Crosse, Wis. | University of Wisconsin-La Crosse, Viterbo University |
| 65 | Lawrence, Kan. | University of Kansas |
| 66 | Auburn, Ala. | Auburn University |
| 67 | Harrisburg, Pa. | Harrisburg University of Science and Technology |
| 68 | Las Cruces, N.M. | New Mexico State University |
| 69 | Houghton, Mich. | Michigan Technological University |
| 70 | Cookeville, Tenn. | Tennessee Technological University |
| 71 | Flagstaff, Ariz. | Northern Arizona University |
| 72 | San Jose, Calif. | San Jose State University |
| 73 | Santa Barbara, Calif. | University of California-Santa Barbara, Albertus Magnus College |
| 74 | Menomonie, Wis. | University of Wisconsin-Stout |
| 75 | Boone, N.C. | Appalachian State University |
| 76 | Knoxville, Tenn. | The University of Tennessee-Knoxville |
| 77 | Raleigh, N.C. | Meredith College, North Carolina State University at Raleigh, Shaw University |
| 78 | Storrs, Conn. | University of Connecticut |
| 79 | Greenville, S.C. | Furman University, Bob Jones University |
| 80 | Philadelphia, Pa. | University of Pennsylvania, Temple University, Chestnut Hill College, Drexel University, Thomas Jefferson University, Saint Joseph's University, La Salle University, Holy Family University |
| 81 | Austin, Texas | The University of Texas at Austin, Saint Edward's University, Huston-Tillotson University, Concordia University Texas |
| 82 | St Louis, Mo. | Washington University in St Louis, Saint Louis University, Fontbonne University, Missouri Baptist University, Harris-Stowe State University, University of Missouri-St Louis, Maryville University of Saint Louis, Webster University |
| 83 | Oxford, Ohio | Miami University-Oxford |
| 84 | Dillon, Mont. | The University of Montana-Western |
| 85 | Ashland, Ore. | Southern Oregon University |
| 86 | Buzzards Bay, Mass. | Massachusetts Maritime Academy |
| 87 | Eau Claire, Wis. | University of Wisconsin-Eau Claire |
| 88 | Cleveland, Ohio | Notre Dame College, Case Western Reserve University, Cleveland State University |
| 89 | New Paltz, N.Y. | State University of New York at New Paltz |
| 90 | Pullman, Wash. | Washington State University |
| 91 | Berrien Springs, Mich. | Andrews University |
| 92 | Kirksville, Mo. | Truman State University |
| 93 | Syracuse, N.Y. | Syracuse University, Le Moyne College, SUNY College of Environmental Science and Forestry |
| 94 | Chicago, Ill. | University of Chicago, Columbia College Chicago, Saint Augustine College, Illinois Institute of Technology, Loyola University Chicago, University of Illinois Chicago, DePaul University, Saint Xavier University, Roosevelt University, North Park University, National Louis University, Chicago State University, Northeastern Illinois University |
| 95 | Buffalo, N.Y. | Canisius College, Medaille College, D'Youville College, University at Buffalo, SUNY Buffalo State |
| 96 | Columbus, Ohio | Ohio State University, Capital University, Ohio Dominican University |
| 97 | Winona, Minn. | Winona State University, Saint Mary's University of Minnesota |
| 98 | Annapolis, Md. | United States Naval Academy |
| 99 | Manhattan, Kan. | Kansas State University |
| 100 | Cedar City, Utah | Southern Utah University |
| 101 | Reno, Nev. | University of Nevada-Reno |
| 102 | Starkville, Miss. | Mississippi State University |
| 103 | University Center, Mich. | Saginaw Valley State University |
| 104 | San Marcos, Texas | Texas State University |
| 105 | Stony Brook, N.Y. | Stony Brook University |
| 106 | Sacramento, Calif. | California State University-Sacramento |
| 107 | Bellingham, Wash. | Western Washington University |
| 108 | Bethlehem, Pa. | Lehigh University, Moravian College |
| 109 | Durham, N.C. | Duke University, North Carolina Central University |
| 110 | Providence, R.I. | Brown University, Providence College, Rhode Island College, Johnson & Wales University-Providence |
| 111 | Bozeman, Mont. | Montana State University |
| 112 | Castine, Maine | Maine Maritime Academy |
| 113 | Greenville, N.C. | East Carolina University |
| 114 | Grand Junction, Colo. | Colorado Mesa University |
| 115 | Cheney, Wash. | Eastern Washington University |
| 116 | Burlington, Vt. | Champlain College, University of Vermont |
| 117 | Appleton, Wis. | Lawrence University |
| 118 | Huntington, W.Va. | Marshall University |
| 119 | Stevens Point, Wis. | University of Wisconsin-Stevens Point |
| 120 | Denton, Texas | University of North Texas, Texas Woman's University |
| 121 | Louisville, Ky. | University of Louisville, Bellarmine University, Spalding University, Sullivan University |
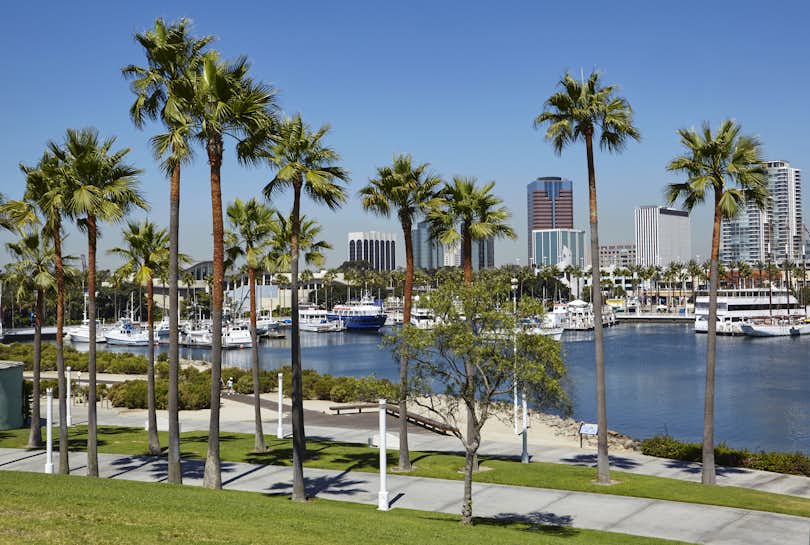
| 122 | Long Beach, Calif. | California State University-Long Beach |
| 123 | Fullerton, Calif. | California State University-Fullerton, Hope International University |
| 124 | Wilmington, N.C. | Platt College-Miller-Motte-Wilmington, University of North Carolina Wilmington |
| 125 | Richardson, Texas | The University of Texas at Dallas |
| 126 | Pembroke, N.C. | University of North Carolina at Pembroke |
| 127 | Mount Pleasant, Mich. | Central Michigan University |
| 128 | Cedar Falls, Iowa | University of Northern Iowa |
| 129 | Platteville, Wis. | University of Wisconsin-Platteville |
| 130 | Lubbock, Texas | Texas Tech University, Lubbock Christian University |
| 131 | Cortland, N.Y. | SUNY Cortland |
| 132 | Newark, N.J. | New Jersey Institute of Technology, Rutgers University-Newark |
| 133 | Terre Haute, Ind. | Indiana State University |
| 134 | San Luis Obispo, Calif. | California Polytechnic State University-San Luis Obispo |
| 135 | Normal, Ill. | Illinois State University |
| 136 | Phoenix, Ariz. | Arizona State University-Downtown Phoenix, University of Phoenix-Arizona, Grand Canyon University |
| 137 | Moscow, Idaho | University of Idaho |
| 138 | Hattiesburg, Miss. | University of Southern Mississippi, William Carey University |
| 139 | Ellensburg, Wash. | Central Washington University |
| 140 | Nashville, Tenn. | Vanderbilt University, Belmont University, Lipscomb University, Tennessee State University, Trevecca Nazarene University |
| 141 | Cullowhee, N.C. | Western Carolina University |
| 142 | Lewisburg, Pa. | Bucknell University |
| 143 | Ruston, La. | Louisiana Tech University |
| 144 | Salisbury, Md. | Salisbury University |
| 145 | Hammond, La. | Southeastern Louisiana University |
| 146 | River Falls, Wis. | University of Wisconsin-River Falls |
| 147 | Chattanooga, Tenn. | The University of Tennessee-Chattanooga |
| 148 | Arcata, Calif. | Humboldt State University |
| 149 | Medford, Mass. | Tufts University |
| 150 | Greensboro, N.C. | Guilford College, University of North Carolina at Greensboro, North Carolina A & T State University |
Most and Least Affordable College Towns
From paying for textbooks to juggling work-study programs, affordability is a major concern for most college students.
To assess the affordability of college towns, we focused on three factors:
- Median Student Loan Debt (-3x): Median student loan principal amount at the time of repayment (typically 6 months after full-time student status ends)
- Net Cost (-4x): Tuition minus average scholarships, aid, and grants
- Rent (-4x): Median monthly rent price for a one-bedroom apartment near campus
Overall, we discovered that where students live can play a major role in their day-to-day living — and how much student debt they accrue. For example, we found that:
- Rent is cheapest is Rolla, Mo. ($450 per month) — roughly 7x less expensive than in Manhattan, N.Y. ($3,516 per month).
- Gainesville, Fla., has the least expensive net cost ($6,302), while Lewisburg, Pa., is the priciest ($42,502).
- Students in Cedar City, Utah, graduate with the least debt ($7,623), while those in Castine, Maine, bear the heaviest burden ($26,545).
Overall, students who live in our 30 least affordable college towns pay $845 more in rent and $12,802 more in net costs on average — and graduate with roughly $5,100 more debt.
» MORE: Reality Check: Exploring Unrealistic Undergraduate Salary Expectations
Affordability in College Towns, by the Numbers
| Criteria | Top 30 | Bottom 30 |
|---|---|---|
| 🏦 Avg. student debt | $13,306 | $18,406 |
| 💰 Avg. annual net cost | $12,964 | $25,766 |
| 🏡 Avg. rent | $777 | $1,622 |
30 Most Affordable College Towns
|
💰 What is the most affordable college town in America?
Cedar City, Utah
|

| City | Rent | Net Cost | Median Student Loan Debt | |
|---|---|---|---|---|
| 1 | Cedar City, Utah | $550 | $14,285 | $7,623 |
| 2 | Las Cruces, N.M. | $695 | $8,659 | $10,830 |
| 3 | Hammond, La. | $625 | $12,171 | $11,000 |
| 4 | Provo, Utah | $895 | $13,322 | $8,750 |
| 5 | Laramie, Wyo. | $663 | $12,159 | $12,003 |
| 6 | Ruston, La. | $515 | $12,084 | $14,080 |
| 7 | Terre Haute, Ind. | $575 | $13,896 | $12,500 |
| 8 | Kirksville, Mo. | $550 | $12,462 | $13,986 |
| 9 | Gainesville, Fla. | $950 | $6,302 | $14,831 |
| 10 | Cookeville, Tenn. | $613 | $15,929 | $11,616 |
| 11 | Huntington, W.Va. | $625 | $8,370 | $16,741 |
| 12 | Dillon, Mont. | $831 | $13,929 | $12,000 |
| 13 | Shepherdstown, W.Va. | $850 | $11,021 | $13,886 |
| 14 | Morgantown, W.Va. | $634 | $12,983 | $14,768 |
| 15 | Grand Junction, Colo. | $800 | $15,569 | $12,000 |
| 16 | Cheney, Wash. | $815 | $12,607 | $14,000 |
| 17 | River Falls, Wis. | $780 | $13,748 | $13,789 |
| 18 | Stillwater, Okla. | $648 | $14,648 | $15,000 |
| 19 | Hattiesburg, Miss. | $797 | $14,923 | $13,808 |
| 20 | Princeton, N.J. | $1,623 | $11,317 | $9,100 |
| 21 | Harrisburg, Pa. | $1,013 | $14,848 | $12,000 |
| 22 | Moscow, Idaho | $525 | $14,132 | $16,750 |
| 23 | Rolla, Mo. | $450 | $14,262 | $17,500 |
| 24 | Pembroke, N.C. | $979 | $10,228 | $15,750 |
| 25 | Oxford, Miss. | $770 | $14,016 | $15,000 |
| 26 | West Lafayette, Ind. | $774 | $13,986 | $15,000 |
| 27 | Ellensburg, Wash. | $925 | $15,397 | $13,000 |
| 28 | Chattanooga, Tenn. | $1,177 | $12,952 | $12,500 |
| 29 | Baton Rouge, La. | $875 | $15,465 | $13,418 |
| 30 | Bloomington, Ind. | $800 | $13,253 | $15,940 |
30 Least Affordable College Towns
|
💰 What is the least affordable college town in America?
Manhattan, N.Y.
|
| City | Rent | Net Cost | Median Student Loan Debt | |
|---|---|---|---|---|
| 1 | Manhattan, N.Y. | $3,516 | $28,697 | $16,301 |
| 2 | Lewisburg, Pa. | $625 | $42,502 | $22,269 |
| 3 | Cleveland, Ohio | $1,075 | $35,428 | $21,725 |
| 4 | Syracuse, N.Y. | $800 | $34,482 | $24,526 |
| 5 | Medford, Mass. | $2,000 | $30,744 | $15,800 |
| 6 | Annapolis, Md. | $1,777 | $26,520 | $19,461 |
| 7 | San Luis Obispo, Calif. | $2,375 | $21,595 | $17,000 |
| 8 | Bethlehem, Pa. | $1,345 | $29,301 | $20,672 |
| 9 | Golden, Colo. | $1,506 | $26,750 | $21,000 |
| 10 | Notre Dame, Ind. | $1,193 | $33,025 | $19,000 |
| 11 | Santa Barbara, Calif. | $3,123 | $15,884 | $13,000 |
| 12 | Buzzards Bay, Mass. | $1,600 | $20,485 | $22,763 |
| 13 | Castine, Maine | $927 | $23,239 | $26,545 |
| 14 | New Brunswick, N.J. | $1,875 | $21,654 | $18,750 |
| 15 | West Chester, Pa. | $1,688 | $22,495 | $19,500 |
| 16 | Ithaca, N.Y. | $990 | $40,126 | $13,500 |
| 17 | Seattle, Wash. | $1,751 | $24,868 | $16,722 |
| 18 | Los Angeles, Calif. | $2,085 | $22,359 | $15,514 |
| 19 | Atlanta, Ga. | $1,739 | $23,716 | $17,500 |
| 20 | Philadelphia, Pa. | $1,334 | $25,986 | $18,571 |
| 21 | University Park, Pa. | $1,095 | $27,372 | $19,500 |
| 22 | Chicago, Ill. | $1,577 | $23,175 | $18,069 |
| 23 | Pittsburgh, Pa. | $1,117 | $26,421 | $19,654 |
| 24 | Providence, R.I. | $1,498 | $28,084 | $15,000 |
| 25 | Austin, Texas | $1,609 | $19,877 | $18,752 |
| 26 | Fairfax, Va. | $1,806 | $21,048 | $16,231 |
| 27 | La Jolla, Calif. | $2,229 | $14,232 | $15,000 |
| 28 | Nashville, Tenn. | $1,485 | $23,043 | $15,318 |
| 29 | Burlington, Vt. | $1,563 | $18,982 | $17,055 |
| 30 | Durham, N.C. | $1,346 | $20,876 | $17,483 |
Best and Worst College Towns for Quality of Life
Outside of the classroom, a great college town offers plenty of opportunities for dining, socializing, and entertainment.
We measured college towns' quality of life by how easy it is to get around, how the student body compares to the local population, and how many sports, restaurants, and entertainment options there are:
- Walk Score (4x): Walkability near the university
- Bike Score (3x): Bikeability near the university
- Entertainment per 100,000 Residents (2.5x): Number of arts, entertainment, and recreation establishments per 100,000 residents
- Restaurants per 100,000 Residents (2.5x): Number of restaurants per 100,000 residents
- Power 5 (2x): Yes / No whether the college is in a Power 5 athletic conference (i.e. ACC, Big Ten, Big 12, Pac-12, SEC)
- Student to Population Ratio (2x): Ratio of students to general population
Overall, the college towns in our top 30 offer more accessible transportation options. Top-rated college towns have an average walk score of 81 and an average bike score of 78 — meaning most errands can be accomplished on foot and that biking is convenient.
By contrast, our bottom-rated college towns have an average walk score of just 56 and an average bike score of 60, so students who don't have a car or access to public transportation may struggle to get around.
When it comes to activities, our top 30 college towns offer plenty to do:
- Top-rated college towns have an average of 143 entertainment options per 100,000 residents, versus just 49 options in our bottom 30 college towns.
- The best college towns have an average of 256 restaurants per 100,000 residents, versus just 109 in our lowest-ranking towns.
- 20 out of our 30 best college towns have universities in a Power 5 athletic conference, compared to just three out of our bottom 30.
Finally, the best college towns have a roughly even mix of year-round residents and students (55%), compared to the relatively low ratio of students in our lowest-ranking towns (33%).
Quality of Life in College Towns, by the Numbers
30 College Towns With Best Quality of Life
|
⭐Which college town has the best quality of life?
Williamsburg, Va.
|
| City | Student to Population Ratio | Walk Score | Bike Score | Entertainment Options per 100k Residents | Restaurants per 100k Residents | Power 5 | |
|---|---|---|---|---|---|---|---|
|
1 |
Williamsburg, Va. | 41% | 62 | 75 | 413 | 865 | - |
|
2 |
Fairfax, Va. | 111% | 66 | 62 | 303 | 666 | - |
|
3 |
Charlottesville, Va. | 36% | 91 | 76 | 194 | 390 | Yes |
|
4 |
Shepherdstown, W.Va. | 137% | 61 | 29 | 260 | 728 | - |
|
5 |
Morgantown, W.Va. | 66% | 88 | 61 | 195 | 301 | Yes |
|
6 |
University Park, Pa. | 178% | 89 | 86 | 57 | 116 | Yes |
|
7 |
Manhattan, N.Y. | 4% | 99 | 85 | 297 | 251 | - |
|
8 |
West Chester, Pa. | 72% | 74 | 53 | 344 | 389 | - |
|
9 |
Boulder, Co. | 28% | 87 | 90 | 168 | 154 | Yes |
|
10 |
Oxford, Miss. | 416% | 32 | 58 | 57 | 116 | Yes |
|
11 |
Fredericksburg, Va. | 14% | 76 | 52 | 214 | 604 | - |
|
12 |
Ann Arbor, Mich. | 26% | 93 | 91 | 87 | 157 | Yes |
|
13 |
Berkeley, Calif. | 26% | 94 | 83 | 95 | 156 | Yes |
|
14 |
East Lansing, Mich. | 82% | 86 | 89 | 44 | 120 | Yes |
|
15 |
Minneapolis, Minn. | 8% | 75 | 86 | 145 | 196 | Yes |
|
16 |
Evanston, Ill. | 12% | 93 | 93 | 74 | 116 | Yes |
|
17 |
Champaign, Ill. | 37% | 80 | 97 | 59 | 136 | Yes |
|
18 |
Eugene, Ore. | 11% | 89 | 96 | 65 | 121 | Yes |
|
19 |
Newark, Del. | 56% | 79 | 74 | 136 | 352 | - |
|
20 |
Pittsburgh, Pa. | 12% | 76 | 69 | 124 | 245 | Yes |
|
21 |
Iowa City, Iowa | 30% | 88 | 90 | 44 | 114 | Yes |
|
22 |
Seattle, Wash. | 5% | 82 | 76 | 98 | 201 | Yes |
|
23 |
New Brunswick, N.J. | 64% | 97 | 71 | 23 | 119 | Yes |
|
24 |
West Lafayette, Ind. | 67% | 79 | 92 | 31 | 91 | Yes |
|
25 |
Pasadena, Calif. | 1% | 83 | 93 | 233 | 157 | - |
|
26 |
Golden, Colo. | 25% | 76 | 69 | 206 | 324 | - |
|
27 |
Princeton, N.J. | 17% | 83 | 87 | 181 | 194 | - |
|
28 |
Lexington, Ky. | 7% | 87 | 88 | 52 | 87 | Yes |
|
29 |
Columbia, Mo. | 18% | 89 | 77 | 62 | 103 | Yes |
|
30 |
Stanford, Calif. | 43% | 69 | 99 | 18 | 116 | Yes |
30 College Towns With Worst Quality of Life
|
⭐Which college town has the worst quality of life?
Long Beach, Calif.
|
| City | Student to Population Ratio | Walk Score | Bike Score | Entertainment Options per 100k Residents | Restaurants per 100k Residents | Power 5 | |
|---|---|---|---|---|---|---|---|
| 1 | Long Beach, Calif. | 7% | 32 | 71 | 37 | 77 | - |
| 2 | Fullerton, Calif. | 25% | 45 | 56 | 29 | 92 | - |
| 3 | Ruston, La. | 37% | 49 | 42 | 55 | 128 | - |
| 4 | Kirksville, Mo. | 25% | 33 | 72 | 40 | 108 | - |
| 5 | Stony Brook, N.Y. | 143% | 27 | 38 | 72 | 145 | - |
| 6 | Medford, Mass. | 10% | 75 | 51 | 28 | 66 | - |
| 7 | Richardson, Texas | 17% | 36 | 79 | 54 | 132 | - |
| 8 | Provo, Utah | 27% | 55 | 71 | 56 | 37 | - |
| 9 | Cedar City, Utah | 21% | 54 | 65 | 64 | 91 | - |
| 10 | Cedar Falls, Iowa | 22% | 53 | 63 | 57 | 122 | - |
| 11 | Sacramento, Calif. | 6% | 43 | 86 | 40 | 130 | - |
| 12 | Greensboro, N.C. | 9% | 70 | 59 | 46 | 97 | - |
| 13 | Salisbury, Md. | 23% | 64 | 52 | 48 | 151 | - |
| 14 | Durham, N.C. | 4% | 50.5 | 43.5 | 43 | 88 | Yes |
| 15 | Denton, Texas | 22% | 66 | 73 | 21 | 75 | - |
| 16 | Pullman, Wash. | 75% | 42 | 37 | 26 | 84 | Yes |
| 17 | Normal, Ill. | 33% | 68 | 69 | 28 | 59 | - |
| 18 | Moscow, Idaho | 28% | 64 | 63 | 54 | 96 | - |
| 19 | Storrs, Conn. | 121% | 48 | 47 | 57 | 116 | - |
| 20 | Las Cruces, N.M. | 11% | 64 | 78 | 30 | 86 | - |
| 21 | Bethlehem, Pa. | 7% | 83 | 40 | 54 | 151 | - |
| 22 | Cullowhee, N.C. | 161% | 40 | 49 | 47 | 116 | - |
| 23 | River Falls, Wis. | 33% | 70 | 58 | 67 | 80 | - |
| 24 | Hammond, La. | 52% | 41 | 50 | 84 | 267 | - |
| 25 | Lubbock, Texas | 12% | 47 | 59 | 35 | 72 | Yes |
| 26 | Cortland, N.Y. | 34% | 64 | 42 | 130 | 141 | - |
| 27 | Newark, N.J. | 6% | 91 | 62 | 9 | 67 | - |
| 28 | Buffalo, N.Y. | 11% | 51 | 63 | 90 | 205 | - |
| 29 | New Haven, Conn. | 11% | 66 | 76 | 35 | 112 | - |
| 30 | Philadelphia, Pa. | 4% | 77 | 72 | 31 | 78 | - |
Best and Worst College Towns by School Quality
It's important for college towns to provide the right ambience — but at the end of the day, students are drawn to college towns where they'll get a great education.
We considered six factors to evaluate the average school quality in each college town:
- Retention Rate (2.5x): The proportion of full-time, first-time, degree/certificate-seeking undergraduates who were enrolled at the institution in the fall one year after enrollment
- Median Pay After Ten Years (2x): Students' median salary after ten years
- Graduation Rate (2x): Percent of students who graduate within 150% of the estimated time to complete the program
- Median Number of Undergrads (1.5x): Enrollment of undergraduate certificate/degree-seeking students
- Spending per Student (1.5x): University spending on instruction per full-time degree-seeking student
- Admission Rate (-1x): Proportion of applicants accepted for admission
In college towns that are home to multiple colleges and universities, we found an average across all schools.
Overall, large schools that invest in their students support better college towns. We found that:
- On average, our top 30 college towns have larger student bodies — averaging 25,642 students, compared to the average 8,639 students in our worst-ranked college towns.
- Students who live in our top 30 college towns are less likely to drop out or transfer (94.2% average retention rate in the best college towns versus 73.6% in the worst) and more likely to graduate on time (87.6% average graduation rate in the best college towns versus 51.3% in the worst).
On average, universities in our top 30 college towns invest $23,119 more in each student annually — and ten years later, graduates' median annual salaries are $28,257 higher.
However, it's also important to acknowledge that college towns in our bottom 30 are more accessible to more students, with an average admission rate of 80.9%, roughly double the average 42.1% admission rate in our top 30 college towns.
Education in College Towns, by the Numbers
| Criteria | Top 30 | Bottom 30 |
|---|---|---|
| ✍️ Avg. number of students | 25,642 | 8,639 |
| 🎓 Avg. graduation rate | 87.6% | 51.3% |
| 📈 Avg. retention rate | 94.2% | 73.6% |
| ✅ Avg. admission rate | 42.1% | 80.9% |
| 💵 Avg. salary after ten years | $68,324 | $40,067 |
| 💰 Annual spending per student | $31,416 | $8,297 |
30 Best College Towns by School Quality
|
🎓Which college town has the best-quality school?
Stanford, Calif.
|
| City | Median No. Students | Graduation Rate | Retention Rate | Median Pay After 10 Yrs. | Admission Rate | Spending per Student | |
|---|---|---|---|---|---|---|---|
| 1 | Stanford, Calif. | 6,994 | 94.3% | 98.8% | $94,000 | 43.4% | $113,338 |
| 2 | Pasadena, Calif. | 938 | 93.6% | 98.3% | $85,900 | 64.2% | $105,185 |
| 3 | Cambridge, Mass. | 12,063 | 96.3% | 98.3% | $97,200 | 56.7% | $63,514 |
| 4 | Los Angeles, Calif. | 80,826 | 78.6% | 90.7% | $60,525 | 28.8% | $33,346 |
| 5 | Princeton, N.J. | 5,308 | 97.9% | 97.7% | $74,700 | 57.8% | $60,048 |
| 6 | Ithaca, N.Y. | 14,976 | 94.5% | 97.5% | $77,200 | 10.9% | $29,893 |
| 7 | Notre Dame, Ind. | 8,689 | 95.9% | 97.8% | $78,400 | 15.8% | $32,634 |
| 8 | Ann Arbor, Mich. | 31,046 | 93.3% | 96.9% | $63,400 | 22.9% | $25,972 |
| 9 | Berkeley, Calif. | 31,345 | 92.6% | 96.9% | $64,700 | 16.3% | $19,585 |
| 10 | Medford, Mass. | 5,828 | 94.3% | 96.1% | $75,800 | 15.0% | $25,888 |
| 11 | Bethlehem, Pa. | 5,164 | 89.8% | 93.5% | $81,900 | 32.1% | $24,995 |
| 12 | Cleveland, Ohio | 5,269 | 84.4% | 93.3% | $74,600 | 27.4% | $31,082 |
| 13 | Evanston, Ill. | 8,530 | 93.8% | 98.2% | $69,000 | 90.5% | $41,227 |
| 14 | Charlottesville, Va. | 16,723 | 94.7% | 97.3% | $61,200 | 23.9% | $20,721 |
| 15 | Chapel Hill, N.C. | 19,014 | 90.6% | 96.4% | $55,600 | 22.6% | $27,786 |
| 16 | La Jolla, Calif. | 30,789 | 87.4% | 93.4% | $59,900 | 31.5% | $20,821 |
| 17 | Manhattan, N.Y. | 61,729 | 70.1% | 86.9% | $56,286 | 49.7% | $27,566 |
| 18 | Gainesville, Fla. | 34,523 | 88.3% | 96.6% | $56,000 | 36.6% | $16,395 |
| 19 | Davis, Calif. | 30,962 | 86.7% | 92.4% | $58,200 | 38.9% | $23,607 |
| 20 | Philadelphia, Pa. | 68,151 | 73.5% | 84.5% | $65,114 | 71.8% | $20,405 |
| 21 | College Station, Texas | 53,119 | 81.7% | 93.2% | $58,000 | 57.8% | $15,424 |
| 22 | College Park, Md. | 29,905 | 87.0% | 95.0% | $62,900 | 44.2% | $14,992 |
| 23 | Lewisburg, Pa. | 3,608 | 90.0% | 92.4% | $70,800 | 34.2% | $23,205 |
| 24 | Golden, Colo. | 5,103 | 82.9% | 91.9% | $84,900 | 53.1% | $17,269 |
| 25 | Lexington, Va. | 3,541 | 86.9% | 90.3% | $70,900 | 39.1% | $26,465 |
| 26 | University Park, Pa. | 74,630 | 70.9% | 87.8% | $50,100 | 75.9% | $22,330 |
| 27 | Madison, Wis. | 31,185 | 87.6% | 95.3% | $56,200 | 54.4% | $16,766 |
| 28 | San Luis Obispo, Calif. | 20,453 | 82.0% | 94.1% | $66,900 | 28.4% | $10,471 |
| 29 | Champaign, Ill. | 33,080 | 85.1% | 92.9% | $61,500 | 59.0% | $14,527 |
| 30 | New Brunswick, N.J. | 35,760 | 83.8% | 92.8% | $57,900 | 61.2% | $17,030 |
30 Worst College Towns by School Quality
|
🎓Which college town has the worst-quality school?
Terre Haute, Ind.
|
| City | Median No. Students | Grad. Rate | Retention Rate | Median Pay After 10 Yrs. | Admission Rate | Spending per Student | |
|---|---|---|---|---|---|---|---|
| 1 | Terre Haute, Ind. | 9,603 | 41.3% | 65.2% | $39,000 | 89.6% | $7,911 |
| 2 | Harrisburg, Pa. | 682 | 30.8% | 71.0% | $43,200 | 79.0% | $5,973 |
| 3 | Hammond, La. | 11,061 | 39.4% | 68.2% | $37,200 | 90.2% | $6,078 |
| 4 | Pembroke, N.C. | 6,270 | 41.1% | 71.6% | $34,400 | 84.9% | $6,815 |
| 5 | Hattiesburg, Miss. | 11,521 | 49.0% | 67.8% | $36,400 | 96.9% | $6,947 |
| 6 | Shepherdstown, W.Va. | 2,631 | 48.6% | 70.6% | $39,700 | 96.3% | $7,686 |
| 7 | Grand Junction, Colo. | 8,260 | 33.7% | 74.3% | $36,800 | 78.2% | $8,096 |
| 8 | Ashland, Ore. | 3,787 | 45.8% | 69.9% | $39,000 | 78.2% | $8,360 |
| 9 | Huntington, W.Va. | 7,750 | 48.6% | 72.6% | $35,600 | 86.9% | $9,501 |
| 10 | Arcata, Calif. | 6,559 | 49.0% | 75.1% | $36,600 | 92.2% | $8,911 |
| 11 | Dillon, Mont. | 1,256 | 48.6% | 75.7% | $30,400 | 56.5% | $7,365 |
| 12 | Chattanooga, Tenn. | 10,185 | 48.5% | 71.3% | $38,100 | 82.1% | $8,677 |
| 13 | Cheney, Wash. | 9,829 | 53.5% | 70.2% | $43,100 | 95.7% | $7,980 |
| 14 | University Center, Mich. | 7,209 | 44.1% | 74.1% | $39,300 | 73.1% | $7,664 |
| 15 | Cedar City, Utah | 7,534 | 50.1% | 73.6% | $39,800 | 78.4% | $6,696 |
| 16 | River Falls, Wis. | 5,399 | 57.8% | 73.8% | $40,900 | 78.9% | $7,125 |
| 17 | Stevens Point, Wis. | 7,349 | 60.2% | 75.0% | $40,200 | 84.5% | $6,725 |
| 18 | Menomonie, Wis. | 7,179 | 60.0% | 72.0% | $45,100 | 90.5% | $8,307 |
| 19 | Ellensburg, Wash. | 10,946 | 57.6% | 70.8% | $46,500 | 84.9% | $9,540 |
| 20 | Cookeville, Tenn. | 8,743 | 54.4% | 77.0% | $40,500 | 79.0% | $8,942 |
| 21 | Las Cruces, N.M. | 11,153 | 48.2% | 74.8% | $34,600 | 54.6% | $13,205 |
| 22 | Platteville, Wis. | 7,222 | 55.9% | 78.8% | $47,300 | 84.8% | $5,192 |
| 23 | Bozeman, Mont. | 14,402 | 56.8% | 76.5% | $43,200 | 81.9% | $8,032 |
| 24 | Moscow, Idaho | 7,227 | 56.1% | 77.3% | $41,900 | 77.8% | $13,461 |
| 25 | Cullowhee, N.C. | 10,292 | 62.5% | 78.2% | $37,700 | 68.7% | $7,446 |
| 26 | Winona, Minn. | 6,800 | 59.2% | 76.5% | $44,700 | 67.9% | $8,324 |
| 27 | Mount Pleasant, Mich. | 14,409 | 61.1% | 74.1% | $41,900 | 69.5% | $8,990 |
| 28 | Ruston, La. | 8,141 | 59.8% | 79.6% | $41,500 | 64.1% | $5,823 |
| 29 | Flagstaff, Ariz. | 26,135 | 56.6% | 77.6% | $40,100 | 84.9% | $6,904 |
| 30 | Laramie, Wyo. | 9,646 | 59.8% | 75.9% | $47,300 | 96.0% | $16,241 |
Methodology
We used data from the Department of Education to create our list of college towns. To qualify, a college town had to have a four-year, degree-granting institution where the majority of students are considered full-time and the majority of degrees awarded are Bachelor-level or higher.
Data for the ranking metrics were sourced from Zumper (rent costs), ApartmentList (rent costs), Walk Score (walkability and bikeability), the U.S. Census (population estimates, number of establishments), and the U.S. Department of Education (all other data points).
The data were categorized into three metrics: affordability, quality of the college(s), and quality of life in the college town.
Affordability measured living expenses and college affordability, with negatively weighted metrics to reflect less affordable towns.
- Median Student Loan Debt (-3x): The median student loan principal amount at the time of repayment (typically ~6 months after full-time student status ends). Missing data were replaced by the median value for schools fitting the same Carnegie Undergraduate Profile Designation.
- Rent (-4x): The median monthly cost of rent for a one-bedroom apartment near campus. If rent data were not available near the college, we used the median cost of a one-bedroom apartment in the town. In very rare cases where those data were not available, rent was considered the median cost of a one-bedroom apartment in the state. The rent cost was averaged across all colleges in the town.
- Net Cost (-4): The net cost of attendance was calculated as the average tuition and fees minus scholarships, aids, and grants across the student body, averaged across each college in the town. Missing data were replaced by the median value for schools fitting the same Carnegie Undergraduate Profile Designation.
Education quality considered the total number of students, exclusivity, retention and graduation rates, graduates' salaries, and resources allotted to instruction at the college.
- Retention Rate (2.5x): The proportion of full-time, first-time, degree/certificate-seeking undergraduates still enrolled in the fall one year after starting at the institution, averaged across all colleges in the town. Missing data were replaced by the median value for schools fitting the same Carnegie Undergraduate Profile Designation.
- Graduation Rate (2x): Percent of students who graduate within 150% of the estimated time to complete their program (e.g., 6 years for a typical 4-year degree program), averaged across all colleges in the town. Missing data were replaced by the median value for schools fitting the same Carnegie Undergraduate Profile Designation.
- Median Pay (2x): Median earnings of students who are working and not enrolled at the college ten years after first enrollment, averaged across all colleges in the town. Missing data were replaced by the median value across all colleges.
- Number of Undergraduate Students (1.5x): Enrollment of undergraduate certificate/degree-seeking students, totaled across all colleges in the town.
- Instructional Expenditures per Student (1.5x): University spending on instruction per full-time, degree-seeking student, averaged across all colleges in the town.
- Admission Rate (-1x): Proportion of applicants accepted for admission, averaged across all colleges in the town. Missing data were replaced by the median value for schools fitting the same Carnegie Undergraduate Profile Designation.
We also considered social and quality of life factors in college towns and surrounding areas.
- Walk score (4x): Walkability near the college, averaged across all colleges.
- Bike score (3x): Bikeability near the college, averaged across all colleges.
- Entertainment establishments (2.5x): Number of arts, entertainment, and recreation establishments per 100,000 residents. Missing data were replaced by the median number of establishments across all towns.
- Restaurants (2.5x): Number of restaurants per 100,000 residents. Missing data were replaced by the median number of establishments across all towns.
- Power 5 Designation (2x): Binary (yes / no) designating whether at least one college in the town is in one of the Power 5 Conferences (ACC, Big 12, Big Ten, Pac-12, SEC).
- Student-to-Population Ratio (2x): Ratio of students enrolled in all colleges in the town to the general population.
Each of the above metrics was calculated across all colleges for a single town (by averaging or summing across the colleges). The data were then standardized using z-scores and multiplied by their respective weight. The weighted score for each metric was summed to create a weighted score for each of the categories (affordability, quality of college, and quality of life) and each of those was summed to create a total score for the overall ranking.
Article Sources
About Clever
Since 2017, Clever Real Estate has been on a mission to make selling or buying a home easier and more affordable for everyone. 12 million annual readers rely on Clever's library of educational content and data-driven research to make smarter real estate decisions—and to date, Clever has helped consumers save more than $70 million on realtor fees. Clever's research has been featured in The New York Times,
Business Insider, Inman, Housing Wire, and many more.
More Research From Clever


FAQs
What are the best college towns in America?
Overall, Stanford, Calif., is the best college town in America — as well as the best for school quality. Williamsburg, Va., has the best quality of life, while Cedar City, Utah, is the most affordable college town. Read our full rankings.
What are the worst college towns in America?
Overall, Greensboro, N.C., ranked last among America's top 150 college towns. Additionally, Manhattan, N.Y., is the least affordable college town; Terre Haute, Ind., ranks last for school quality, and Long Beach, Calif., came last for quality of life.
Read our full rankings.