
| 🚌 A Commuter's Oasis: Salt Lake City 🚌 Salt Lake City is 2023's best city for commuters. Drivers in Salt Lake City spend an average of 12 hours a year on their commutes to work. That's 76% fewer hours than the average American driver, who loses 51 hours per year sitting in traffic. |
Best (and Worst) Cities for Commuters, Ranked | Top 15 Commuter Cities | Top Commuter Cities by Category | 10 Worst Commuter Cities | Public Transit Rankings | Commute Calculator | Methodology | FAQ
Dreading your daily commute or just the drive to the grocery store? You're not alone. To the chagrin of climate scientists, the COVID-19 pandemic has seemingly increased the number of Americans using their vehicles over public transportation. That increase in traffic isn't all in your head.
Meanwhile, despite growing urban populations, most metro areas have made only modest improvements to their public transit systems. A vexing question arises: Is commuting actually worth it?
Recent statistics reveal that working remotely saves workers an average of two hours per week in commute time, resulting in time that is being repurposed, such as doing more work, caregiving, and leisure.
Intriguingly, emerging research underscores the detrimental health impacts of even relatively short commutes — as brief as approximately 2 miles. But most Americans aren't given the opportunity to work from home.
Merely 27% of the U.S. workforce works from home. Furthermore, as numerous companies advocate for a return to in-person office settings, a deepening divide is growing between employers and employees in an already tense economic climate. In light of this public discourse, this study aims to find where commuters fare best.
To find the best cities for commuters, we looked at the 50 most-populated metros in the U.S. and ranked them against the following metrics:
- 4x: Annual hours lost to traffic: Average hours per year lost to traffic or congestion.
- 3x: Percent of workers who work from home: The percentage of workers 16 and over who work from home.
- 3x: Transit score: Public transit score given to each city by Walkscore.com.
- 2x: Time to work: Average minutes per day spent commuting to work one way.
- 2x: Annual cost of commuting as a percent of income: How much of their income the average commuter spends on commuting every year.
- 2x: Annual fuel cost: How much money does the average commuter spend on fuel per year.
- 2x: Annual maintenance cost: How much money the average commuter spends on maintenance per year.
- 2x: Average annual insurance premium: The average annual cost of insurance in the metro area.
- 2x: Percent of workers who commute by public transit, excluding taxis: The percentage of workers 16 and over who commute to work by public transit.
- 1x: Distance of commute in miles: How far the average commute is in this metro.
- 1x: Opportunity cost: How much potential income is lost to time spent commuting to work.
- 1x: MPH during commute : Average MPH achieved during commute. A lower MPH means you're spending a lot of time going a short distance.
- 1x: Percent of major road miles in 'poor' condition: The percentage of miles of major roads surveyed — interstate, other freeways and expressways, other principal arterial, and minor arterial — that are in poor condition per the Federal Highway Administration's international roughness index.
Keep reading to find out more about the most commuter-friendly metro areas and the dreaded daily schleps that some Americans have to make to work.
Best Commuter Cities Stats 🛣
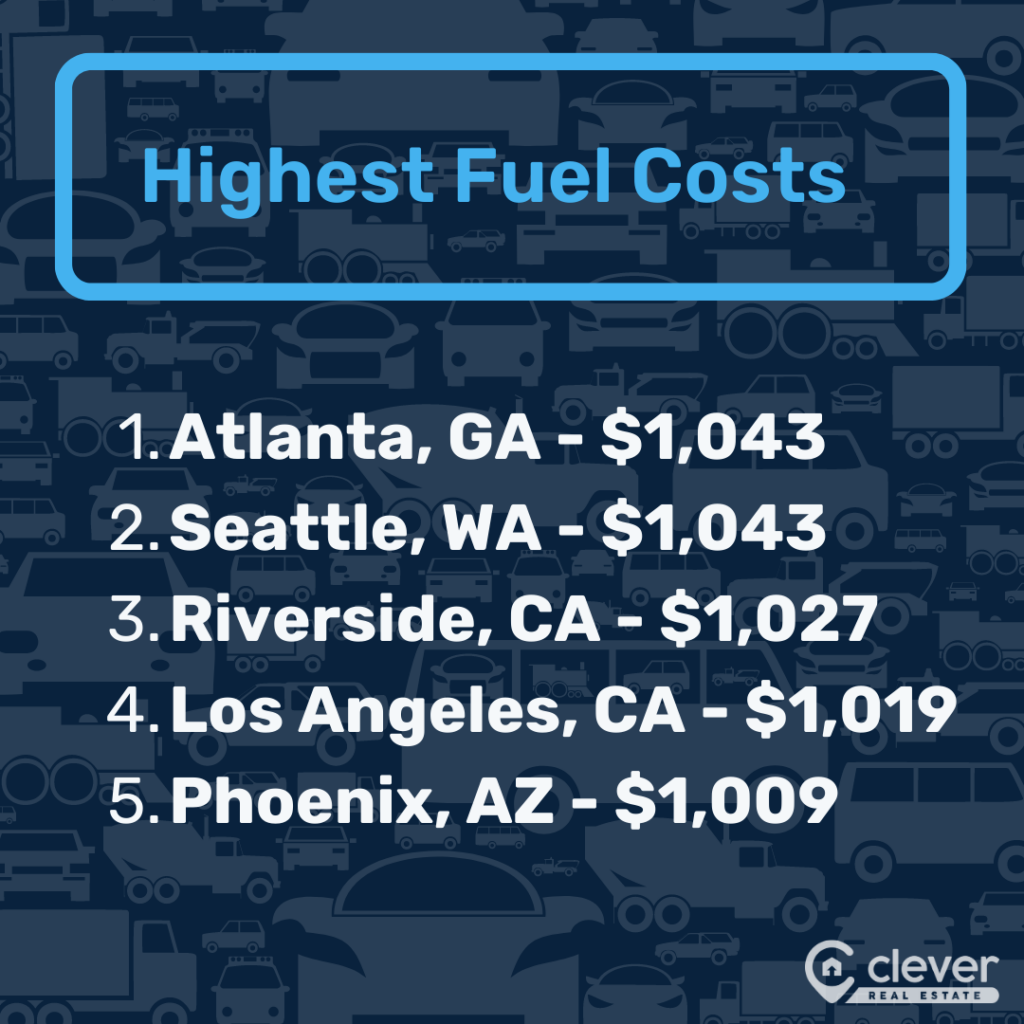
- Seattle has the highest average gas price per gallon ($5.10), while New Orleans has the lowest ($3.36). Jump to section👇
- The average commute time in the U.S. is 234 hours per year — or 27 minutes one way — and Americans spend an average of $8,189 commuting yearly. That's a 2.1% decrease in time and a 3.3% decrease in cost from the 239 hours and $8,466 spent on their commute in 2022. 👇
- Salt Lake City is the No. 1 city for commuters. Residents spend just 23 minutes one way and $6,527 on their annual commute. 👇
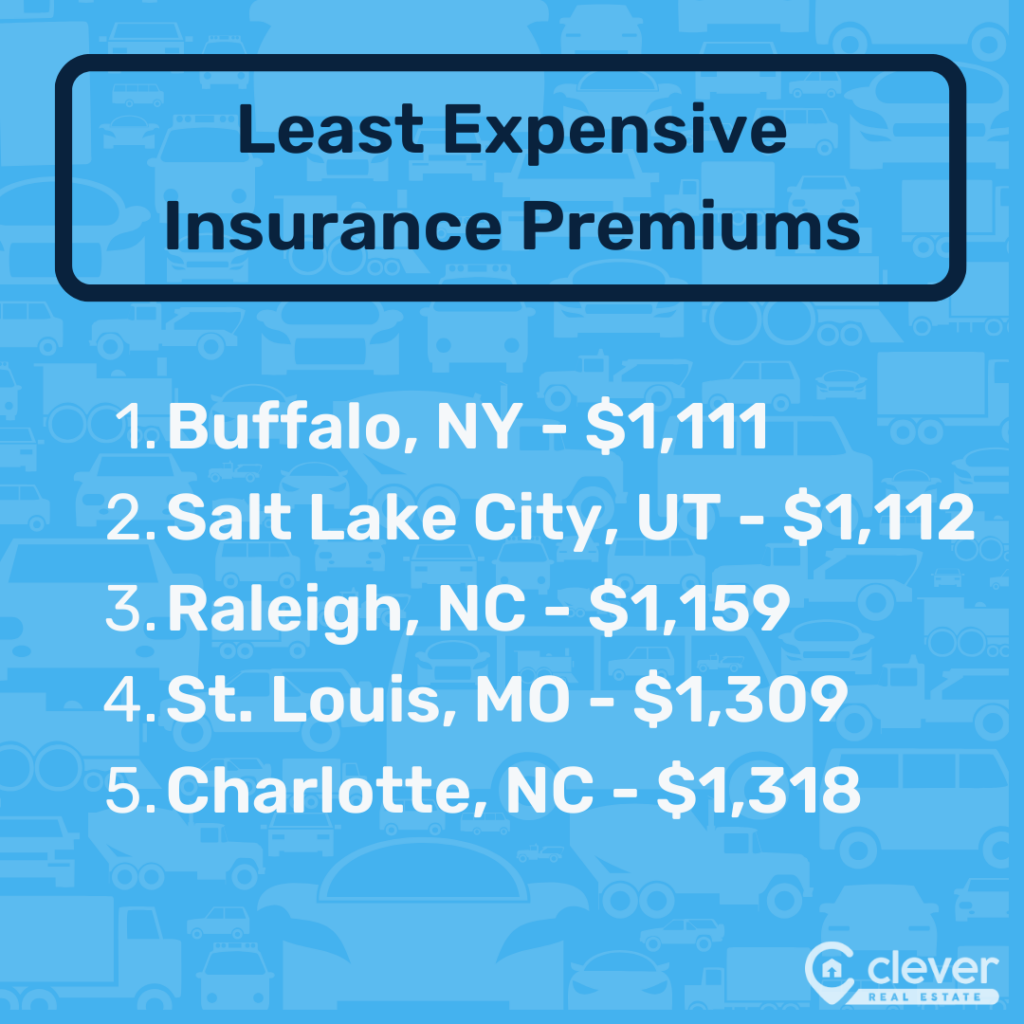
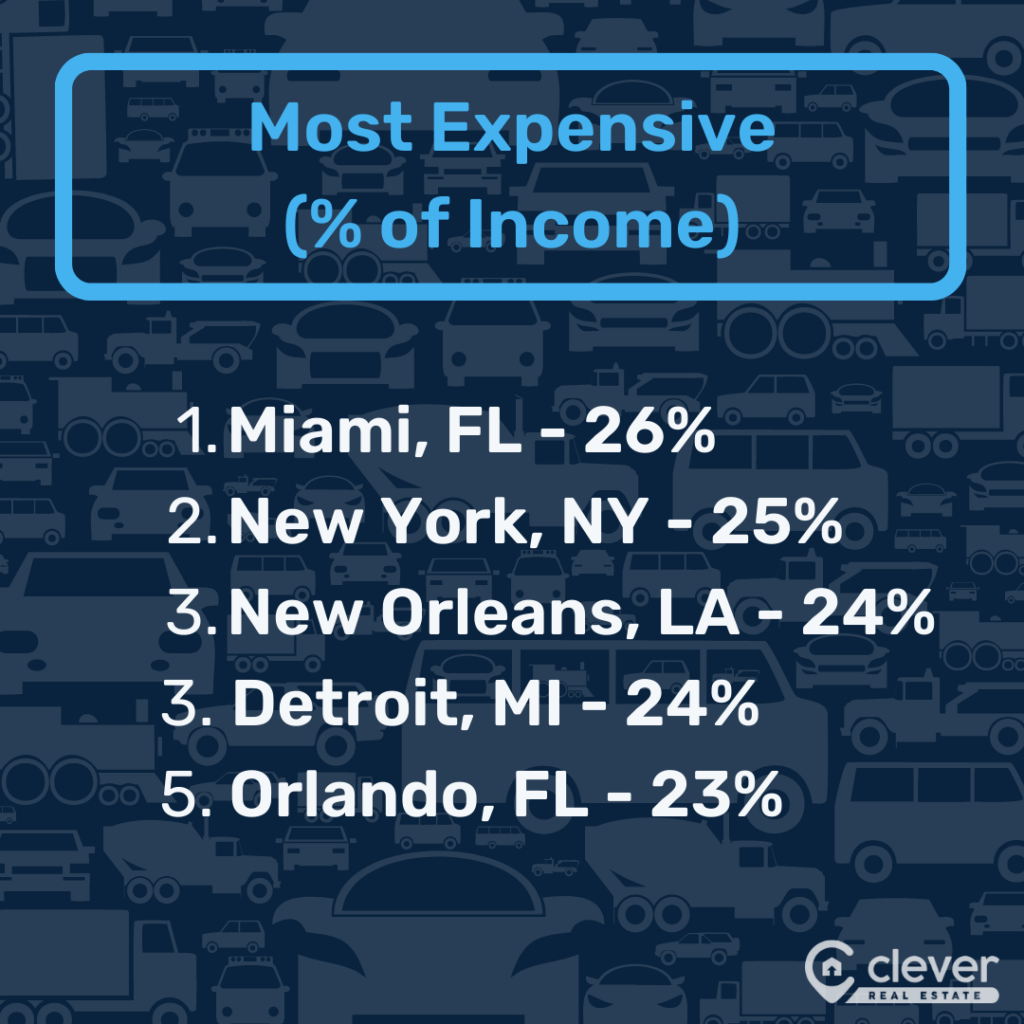
- Buffalo, New York, is the most affordable city for commuting, while Miami is the most expensive.👇
- Buffalo has the shortest one-way commute (22 minutes), while New York City has the longest (37 minutes).👇
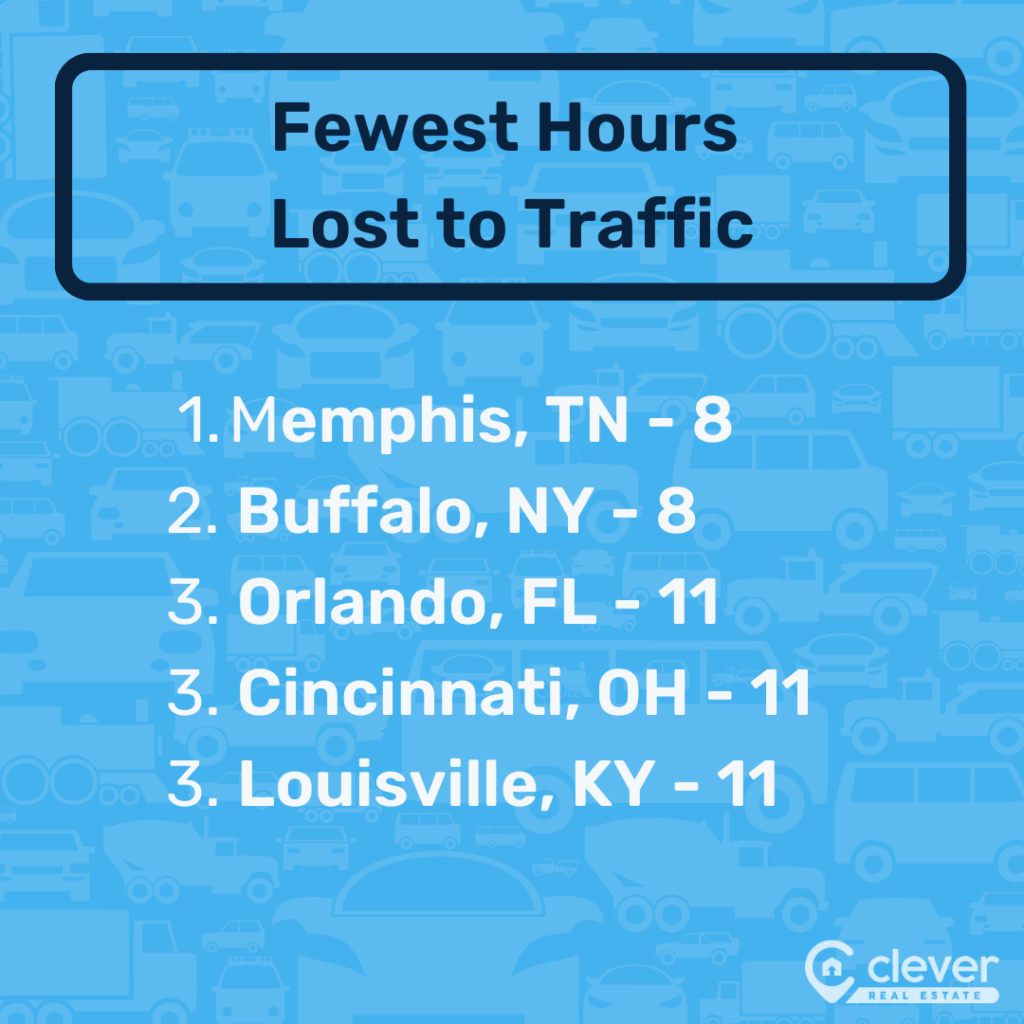
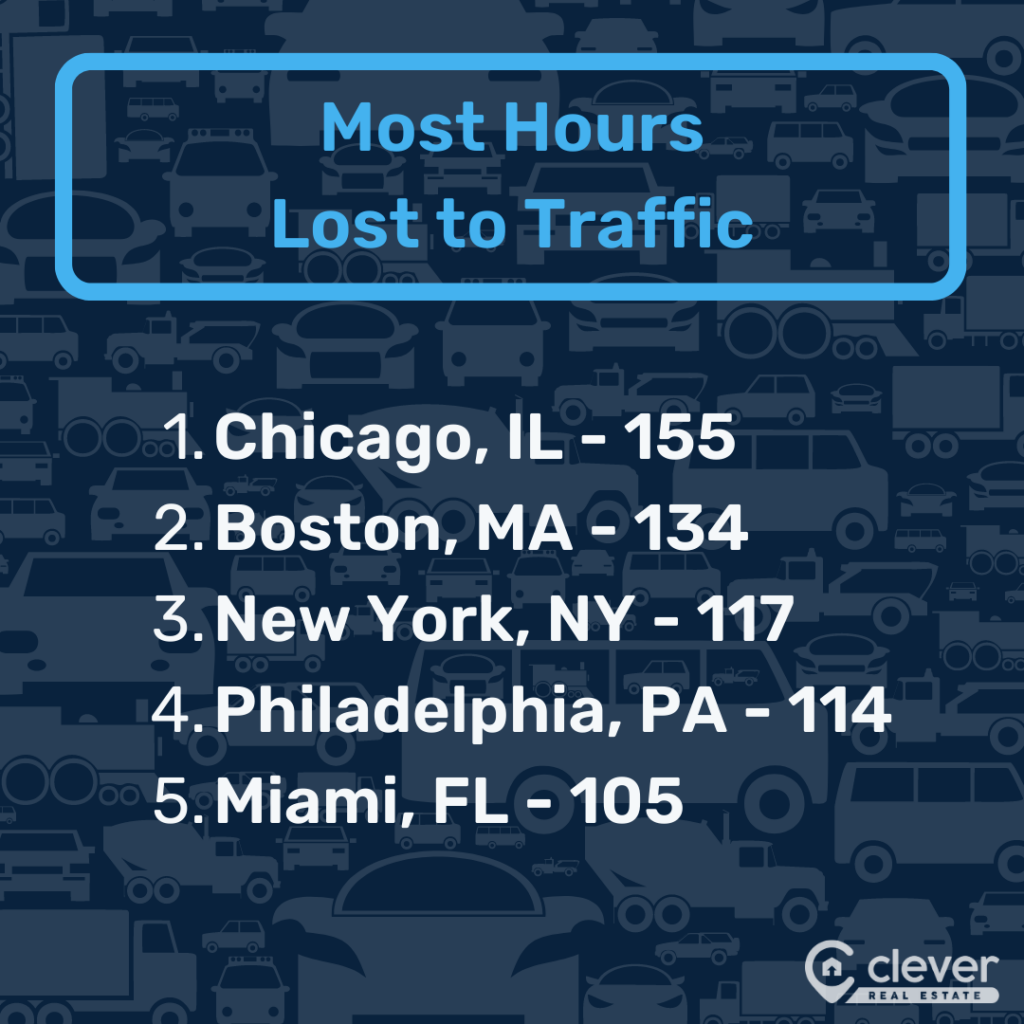
- Buffalo and Memphis drivers lose the fewest annual hours to traffic at just eight, while drivers in Chicago lose the most time out of any city — 155 hours annually.👇
- The worst city for commuting is Houston, where the average commuter spends $933 on fuel just to get to work every year.👇
- New York City is the best city for public transportation with a transit score of 89 out of 100 and 27.8% of workers commuting via public transit.👇
- The worst city for public transportation is Oklahoma City, with a transit score of 17.👇
The 50 Best (and Worst) Cities for Commuters, Ranked
| Rank | City | Minutes to Work | Annual Hours Lost to Traffic | Annual Fuel Cost | One-Way Commute Distance (Miles) | Public Transit Score | Annual Insurance Premium | Annual Vehicle Maintenance Cost | Annual Opportunity Cost* | % of Income Spent on Commuting | % of Workers Commuting via Public Transit | % of Workers Who Work Remotely | Annual Cost of Commute | % of Major Roads in "Poor" Condition | % Change in Total Cost From 2022** |
| - | United States | 27 | 51 | $763 | 8.8 | 42 | $1,759 | $458 | $5,209 | 18% | 3.5% | 9.7% | $8,189 | 16.6% | -3% |
| 1 | Salt Lake City, UT | 23 | 12 | $582 | 6.5 | 44 | $1,112 | $338 | $4,456 | 14% | 2.8% | 12.5% | $6,527 | 14.3% | 0.1% |
| 2 | Buffalo, NY | 22 | 8 | $551 | 6.5 | 47 | $1,111 | $338 | $4,157 | 13% | 2.8% | 7.3% | $6,254 | 11.7% | -2.7% |
| 3 | Raleigh, NC | 27 | 14 | $681 | 8.5 | 29 | $1,159 | $442 | $5,277 | 16% | 0.7% | 16.8% | $7,559 | 6.9% | 8.2% |
| 4 | Hartford, CT | 24 | 30 | $619 | 7.3 | 53 | $2,188 | $380 | $4,921 | 16% | 2.4% | 10.6% | $8,108 | 11.4% | -5.5% |
| 5 | Columbus, OH | 24 | 18 | $686 | 8.6 | 30 | $1,350 | $447 | $4,697 | 15% | 1.3% | 11.6% | $7,161 | 12.6% | 8.5% |
| 6 | Milwaukee, WI | 23 | 32 | $603 | 7.4 | 49 | $1,826 | $385 | $4,495 | 16% | 2.5% | 9.5% | $7,309 | 32.8% | 7.9% |
| 7 | Cleveland, OH | 25 | 20 | $619 | 7.8 | 44 | $1,522 | $406 | $4,791 | 16% | 2.4% | 8.8% | $7,416 | 24.0% | 9.9% |
| 8 | Cincinnati, OH | 25 | 11 | $692 | 8.7 | 44 | $1,334 | $452 | $4,455 | 16% | 1.4% | 9.1% | $6,915 | 16.4% | 2.3% |
| 9 | Minneapolis, MN | 25 | 26 | $809 | 9.5 | 55 | $1,949 | $494 | $5,106 | 17% | 3.6% | 13.1% | $8,318 | 3.7% | 0.8% |
| 10 | Richmond, VA | 25 | 23 | $715 | 8.7 | 42 | $1,630 | $452 | $4,867 | 17% | 1.3% | 11.9% | $7,588 | 9.8% | 10.1% |
| 11 | Pittsburgh, PA | 27 | 34 | $707 | 8.1 | 55 | $1,870 | $421 | $5,161 | 18% | 4.7% | 10.8% | $8,197 | 14.7% | 9.1% |
| 12 | Portland, OR | 26 | 72 | $757 | 7.1 | 49 | $1,858 | $369 | $5,322 | 17% | 5% | 14.4% | $8,225 | 11.1% | -0.6% |
| 13 | Virginia Beach, VA | 25 | 12 | $629 | 7.6 | 21 | $1,606 | $395 | $4,153 | 17% | 1.4% | 7.5% | $6,833 | 19.7% | 7.3% |
| 14 | Louisville, KY | 24 | 11 | $632 | 7.6 | 27 | $2,775 | $395 | $3,859 | 20% | 1.5% | 8.7% | $7,677 | 10.8% | 1.6% |
| 15 | Austin, TX | 28 | 53 | $679 | 8.6 | 35 | $1,966 | $447 | $5,374 | 18% | 1.5% | 16.8% | $8,564 | 9.5% | 12.6% |
| 16 | Kansas City, MO | 24 | 17 | $720 | 8.9 | 25 | $2,154 | $463 | $4,460 | 17% | 0.8% | 10.6% | $7,892 | 12.8% | 6.6% |
| 17 | St. Louis, MO | 26 | 17 | $811 | 10 | 43 | $1,309 | $520 | $4,681 | 17% | 1.7% | 9.8% | $7,413 | 14.4% | -12.1% |
| 18 | San Jose, CA | 29 | 46 | $715 | 6.4 | 40 | $1,923 | $333 | $9,063 | 16% | 3.3% | 15.3% | $12,097 | 25.6% | 4.8% |
| 19 | Tampa, FL | 28 | 30 | $710 | 8.5 | 31 | $1,827 | $442 | $4,415 | 19% | 1% | 12.4% | $7,442 | 5.2% | -14.3% |
| 20 | Oklahoma City, OK | 23 | 14 | $668 | 8.6 | 17 | $2,068 | $447 | $3,704 | 18% | 0.4% | 7.0% | $6,855 | 9.6% | -0.2% |
| 21 | Charlotte, NC | 27 | 25 | $798 | 9.7 | 27 | $1,318 | $504 | $5,090 | 17% | 1.3% | 13.1% | $7,710 | 11.4% | 8.0% |
| 22 | Indianapolis, IN | 25 | 24 | $764 | 9.2 | 25 | $1,398 | $478 | $4,170 | 17% | 0.8% | 9.8% | $6,761 | 12.7% | -1.9% |
| 23 | Memphis, TN | 24 | 8 | $699 | 8.9 | 22 | $1,954 | $463 | $3,842 | 18% | 0.5% | 5.7% | $6,895 | 16.1% | -0.7% |
| 24 | Denver, CO | 28 | 54 | $757 | 8.5 | 45 | $2,396 | $442 | $5,680 | 19% | 3.3% | 15.4% | $9,336 | 21.1% | 4.7% |
| 25 | Las Vegas, NV | 25 | 41 | $689 | 7.2 | 36 | $2,856 | $374 | $3,911 | 21% | 2.7% | 7.4% | $7,830 | 12.2% | 0.6% |
| 26 | Providence, RI | 26 | 42 | $733 | 8.8 | 47 | $1,873 | $456 | $5,192 | 17% | 2.1% | 7.8% | $8,195 | 24.6% | -10.2% |
| 27 | San Antonio, TX | 27 | 32 | $684 | 8.8 | 31 | $2,071 | $458 | $4,207 | 20% | 1.4% | 9.1% | $7,484 | 17.2% | 8.8% |
| 28 | San Diego, CA | 26 | 54 | $970 | 8.5 | 37 | $1,844 | $442 | $5,265 | 18% | 2.4% | 12.5% | $8,461 | 14.0% | -2.2% |
| 29 | Sacramento, CA | 28 | 36 | $889 | 8 | 34 | $2,100 | $416 | $5,606 | 19% | 1.9% | 13.1% | $9,071 | 25.4% | -0.1% |
| 30 | Jacksonville, FL | 26 | 24 | $762 | 9.1 | 21 | $2,745 | $473 | $4,176 | 21% | 1% | 10.5% | $8,092 | 3.0% | 3.7% |
| 31 | Seattle, WA | 31 | 46 | $1,043 | 9 | 60 | $2,157 | $468 | $7,705 | 19% | 7.9% | 14.9% | $11,449 | 20.0% | 8.6% |
| 32 | Orlando, FL | 29 | 11 | $757 | 9.1 | 33 | $2,958 | $473 | $4,594 | 23% | 1.2% | 10.2% | $8,720 | 5.5% | 8.2% |
| 33 | Birmingham, AL | 27 | 24 | $775 | 10.1 | 21 | $1,648 | $525 | $4,288 | 19% | 0.4% | 7.6% | $7,268 | 12.6% | -2.5% |
| 34 | San Francisco, CA | 33 | 97 | $915 | 8 | 77 | $2,295 | $416 | $8,629 | 20% | 13.8% | 16.3% | $12,152 | 26.6% | -1.7% |
| 35 | Washington, DC | 34 | 83 | $798 | 9.1 | 69 | $2,212 | $473 | $8,808 | 20% | 10.1% | 15.4% | $12,214 | 16.0% | 5.7% |
| 36 | Nashville, TN | 28 | 41 | $879 | 11 | 22 | $1,546 | $572 | $4,565 | 19% | 0.8% | 11.6% | $7,579 | 4.0% | -3.9% |
| 37 | Baltimore, MD | 31 | 55 | $731 | 8.6 | 53 | $2,971 | $447 | $6,149 | 22% | 5% | 11.2% | $10,358 | 20.0% | 8.6% |
| 38 | Boston, MA | 31 | 134 | $733 | 8.8 | 72 | $1,827 | $456 | $7,852 | 18% | 10.7% | 13.% | $10,842 | 22.3% | 3.1% |
| 39 | New Orleans, LA | 26 | 77 | $473 | 6.2 | 44 | $4,087 | $322 | $4,108 | 24% | 2% | 7.4% | $9,006 | 29.6% | 2.6% |
| 40 | Phoenix, AZ | 27 | 26 | $1,009 | 11.4 | 36 | $2,210 | $593 | $5,089 | 20% | 1.4% | 13.% | $8,939 | 17.6% | 9.0% |
| 41 | Philadelphia, PA | 30 | 114 | $692 | 7.8 | 67 | $3,315 | $406 | $5,882 | 22% | 7.9% | 11.7% | $10,354 | 22.2% | 7.7% |
| 42 | New York, NY | 37 | 117 | $671 | 7.7 | 89 | $4,545 | $400 | $8,534 | 25% | 27.8% | 10.6% | $14,219 | 29.1% | 17.0% |
| 43 | Dallas, TX | 28 | 56 | $978 | 12.2 | 39 | $2,340 | $634 | $5,343 | 20% | 1% | 11.1% | $9,257 | 25.8% | 10.7% |
| 44 | Miami, FL | 30 | 105 | $715 | 8.6 | 57 | $3,938 | $447 | $4,769 | 26% | 2.6% | 9.2% | $9,933 | 9.4% | 8.9% |
| 45 | Detroit, MI | 27 | 23 | $871 | 10.4 | 36 | $4,726 | $541 | $5,292 | 24% | 1.2% | 9.3% | $11,490 | 28.4% | -10.2% |
| 46 | Riverside, CA | 33 | 46 | $1,027 | 9.1 | 30 | $1,970 | $473 | $5,414 | 23% | 1% | 7.9% | $8,835 | 17.8% | -2.7% |
| 47 | Los Angeles, CA | 31 | 95 | $1,019 | 8.8 | 53 | $2,688 | $458 | $6,045 | 22% | 4.1% | 11.2% | $10,309 | 34.2% | 2.1% |
| 48 | Atlanta, GA | 32 | 74 | $1,043 | 12.8 | 44 | $2,322 | $666 | $6,069 | 22% | 2.4% | 13.2% | $10,138 | 5.8% | 8.4% |
| 49 | Chicago, IL | 31 | 155 | $967 | 10 | 65 | $2,171 | $520 | $6,169 | 21% | 10% | 10.9% | $9,767 | 21.4% | 5.5% |
| 50 | Houston, TX | 30 | 74 | $933 | 12.2 | 36 | $2,365 | $634 | $5,542 | 21% | 1.8% | 8.7% | $9,512 | 26.7% | 10.8% |
| *Measures how much potential income is lost to time spent commuting to work. **Based on a city's total annual commute cost from 2022. | |||||||||||||||
The 15 Best Cities for Commuters
Last year, the top three cities for commuters were Buffalo, New York; Salt Lake City; and Milwaukee. This year, Salt Lake City dethroned Buffalo, while Milwaukee dropped out of the top three, falling to sixth place behind Raleigh, North Carolina; Hartford, Connecticut; and Columbus, Ohio.
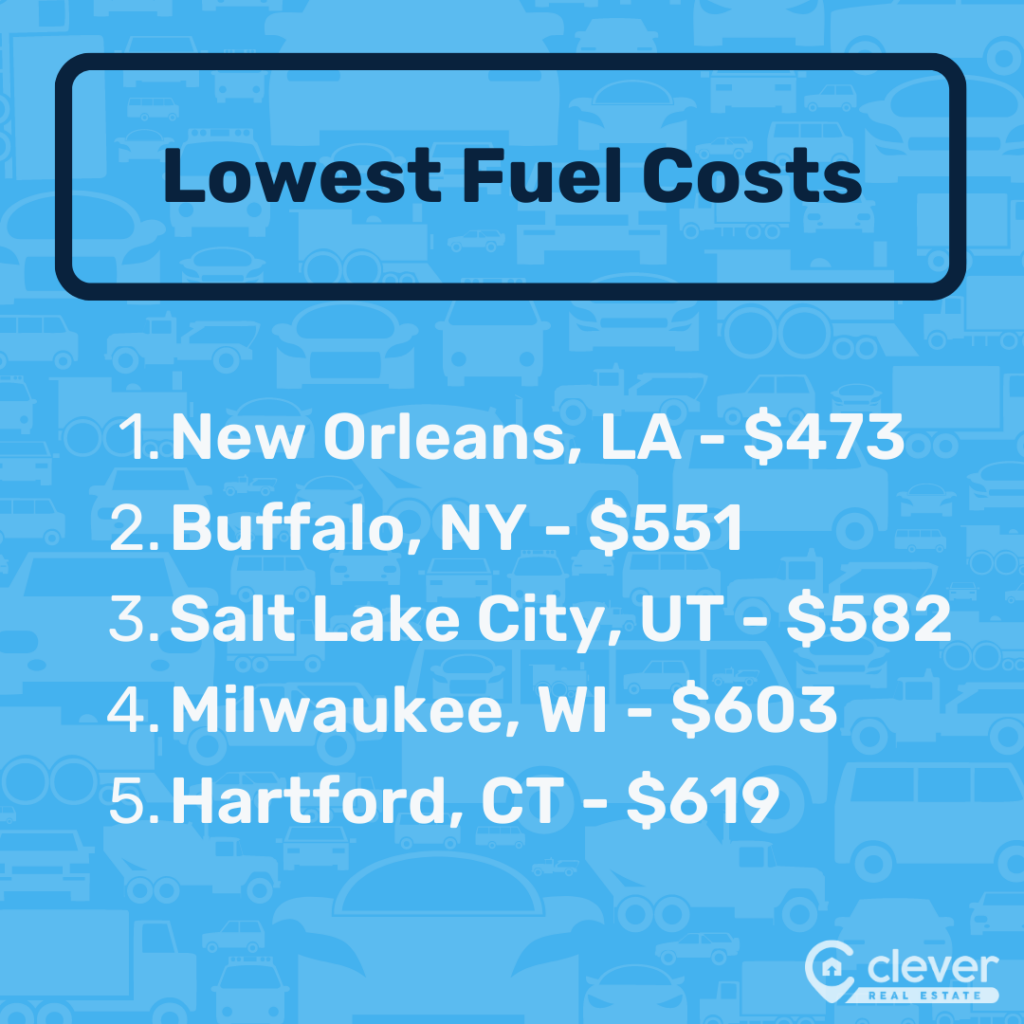
Overall, gas prices have fallen from 2022. Last year, Salt Lake City's annual cost of fuel was $648. This year, it dropped to $582. Despite not making the top 15 best cities for commuters, New Orleans has the lowest average cost of fuel among all 50 metro areas at $3.36 per gallon. Seattle has the highest at $5.10 per gallon.
Buffalo may have fallen to second place this year, but it still wins in affordability. Based on all financial metrics, it's the most affordable city for commuters, while Miami is the most expensive.
| City | 2023 Rank | 2022 Rank | Rank Change +/- |
| Salt Lake City, UT | 1 | 2 | 1 |
| Buffalo, NY | 2 | 1 | -1 |
| Raleigh, NC | 3 | 10 | 7 |
| Hartford, CT | 4 | 7 | 3 |
| Columbus, OH | 5 | 6 | 1 |
| Milwaukee, WI | 6 | 3 | -3 |
| Cleveland, OH | 7 | 5 | -2 |
| Cincinnati, OH | 8 | 9 | 1 |
| Minneapolis, MN | 9 | 20 | 11 |
| Richmond, VA | 10 | 11 | 1 |
| Pittsburgh, PA | 11 | 14 | 3 |
| Portland, OR | 12 | 17 | 5 |
| Virginia Beach, VA | 13 | 4 | -9 |
| Louisville, KY | 14 | 13 | -1 |
| Austin, TX | 15 | 19 | 4 |
1. Salt Lake City, UT
| 🏆 Ensured Savings It's no secret that car insurance premiums are going up. Luckily for drivers in Salt Lake City, the average annual insurance premium is just $1,112 – 37% less than the average U.S. driver pays ($1,759). |
Commuters in Salt Lake City experience several advantages when it comes to their daily travel costs and time. They spend approximately $582 annually on fuel, 24% less than the national average of $763 for commuters across the U.S.
Moreover, Salt Lake City drivers lose a mere 12 hours to traffic each year, 76% fewer hours than the average U.S. driver loses (51 hours).
Salt Lake City commuters benefit from reduced vehicle maintenance expenses as well. They incur around $338 yearly – a significant 26% less than the typical U.S. commuter ($458).
This financial advantage is complemented by the fact that 12.5% of workers in Salt Lake City have the convenience of working from home. That's 29% more remote workers than the average U.S. city (9.7%).
» Average commute time in Salt Lake City: 23 minutes
» Read more stats on Utah
2. Buffalo, NY
| ⏰ Time Better Spent Drivers in Buffalo lose just an average of eight hours to traffic every year. That's 84% fewer hours than the average U.S. driver, who loses 51 hours! |
Based on all finance-related metrics, Buffalo is the most affordable city for commuters. But that's not all. Buffalo also has the shortest one-way commute time in the entire study at just 22 minutes!
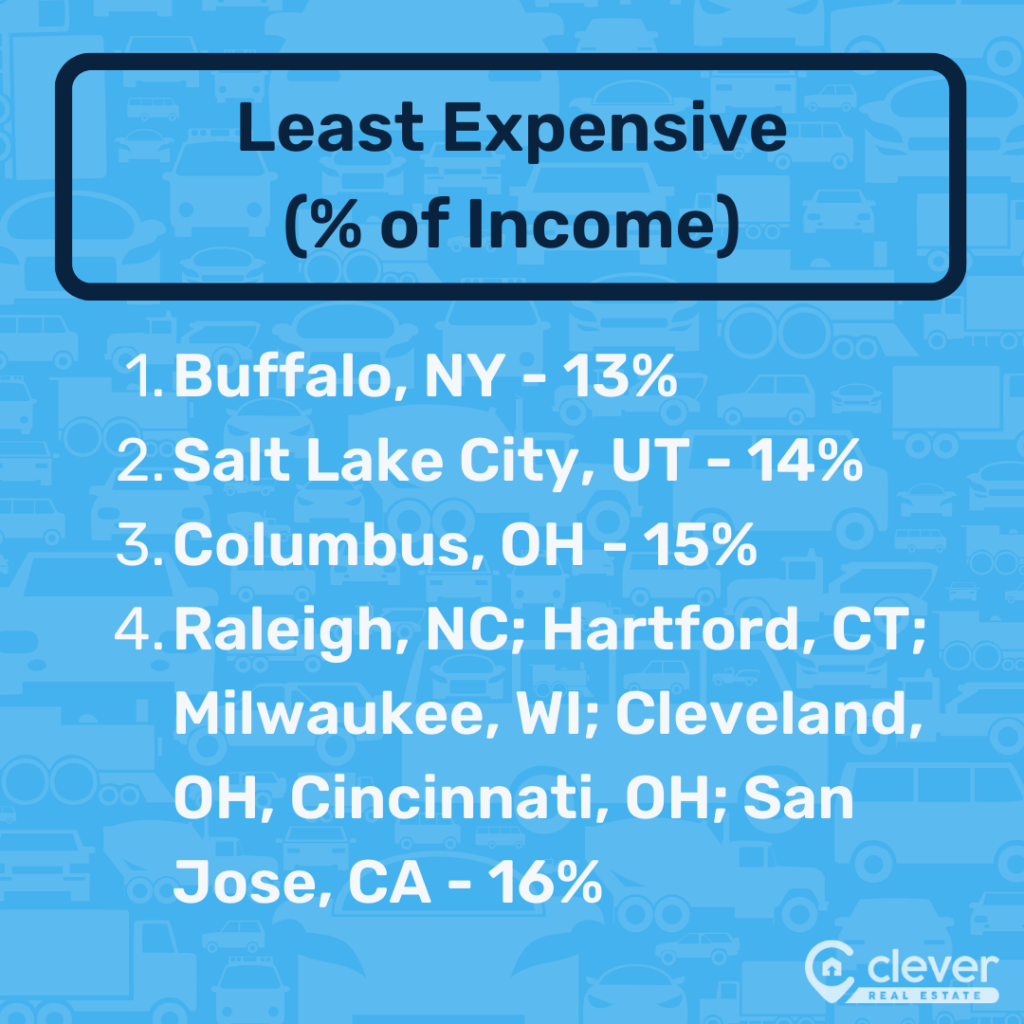
Commuters in Buffalo also spend just 13% of their income on their commute every year, compared to 18% for the average U.S. commuter. That's a 28% difference. They also only shell out about $551 each year for fuel to get around. That's also 28% less than the $763 the average U.S. commuter spends.
Meanwhile, Buffalo drivers also have an advantage when it comes to insurance costs, with an average annual premium of $1,111 — 37% less than the U.S. average ($1,759).
» Average commute time in Buffalo: 22 minutes
» Read more stats on New York
3. Raleigh, NC
| 🏡 Working from Home Works In Raleigh, remote workers constitute 16.8% of the workforce — 73% more than the typical city's remote workforce (9.7%). |
Commuters in Raleigh spend $681 yearly on fuel, 11% less than the national average ($763). Additionally, Raleigh drivers lose a mere 14 hours to traffic annually, 73% fewer hours than average (51).
Furthermore, drivers in Raleigh benefit from more affordable insurance premiums, paying an average annual cost of $1,159, or 34% less than average ($1,759).
Adding to the city's appeal, just 6.9% of major roads in Raleigh are in poor condition, 60% fewer than the national average of 17.4%.
» Average commute time in Raleigh: 27 minutes
» Read more stats on North Carolina
4. Hartford, CT
| 🔴 No Sitting in Traffic Although it's hard to compete with Buffalo's eight-hour annual traffic loss, Hartford commuters lose just 30 hours on average to traffic every year. That's 41% fewer hours than drivers in the average American metro (51). |
Hartford commuters enjoy a financial edge, spending approximately $619 annually on fuel – 19% less than the national average of $763.
The benefits don't stop there. Hartford commuters also retain more of their hard-earned dollars, losing about $4,921 in potential income each year due to their commutes. That's 6% less than the $5,209 carried by the typical U.S. commuter.
The city's roadways also paint a promising picture. Although 17.4% of major roads in urbanized U.S. areas suffer from neglect, Hartford stands apart with only 11.4% of its major roads in poor condition – a remarkable 34% less than average.
» Average commute time in Hartford: 24 minutes
» Read more stats on Connecticut
5. Columbus, OH
| 💸 Insuring Excellence Drivers in Columbus are one fortunate bunch. They enjoy an average annual insurance premium of $1,350, 23% less the $1,759 the average U.S. driver pays! |
Drivers in Columbus escape the clutches of traffic, losing a mere 18 hours per year on average. This stands as an impressive 65% fewer hours than the nationwide norm of 51 hours.
Yet the perks of Columbus don't end there. Commuters in the city also lose less income because of their commutes than the average American — just $4,697 annually, 10% less than the U.S. average ($5,209).
The roads themselves reflect the city's dedication to smoother journeys. In a country where 17.4% of major roads in urban areas languish in poor condition, Columbus shines by having only 12.6% of afflicted roads — a notable 28% fewer stretches of potholes and uneven lanes.
» Average commute time in Columbus: 24 minutes
» Read more stats on Ohio
6. Milwaukee, WI
| ⛽ Cheap Fuel Commuters in Milwaukee spend just $603 on fuel to commute every year. That's 21% less than the average American, who spends $763 a year on gas. |
With an average of 32 hours lost to traffic each year, Milwaukee drivers spend 37% fewer hours stuck in traffic than the average American (51). Not only is time conserved, but their wallets are, too. Commuters in Milwaukee spend about $385 on annual vehicle maintenance — 16% less than the typical $458 shelled out.
The daily commute in Milwaukee is also fairly streamlined, with local commuters spending a mere 23 minutes on one-way drives to work — 15% less than the U.S. average of 27 minutes.
» Average commute time in Milwaukee: 23 minutes
» Read more stats on Wisconsin
7. Cleveland, OH
| 💰 Wallet-Friendly Journeys It's not exactly fun to visualize how much money you lose commuting to work. Thankfully for Clevelanders, they lose just $4,791 in potential income every year to their commutes, 8% less than the average American ($5,209). |
With an annual fuel expenditure of approximately $619, commuters in Cleveland spend 19% less than the average American getting to work ($763). As they navigate to work, drivers in Cleveland conquer time, losing just 20 hours annually to traffic — 61% less than the 51-hour norm the average U.S. driver experiences.
Cleveland drivers also enjoy cost-effective protection, boasting an average annual insurance premium of $1,522. This not only secures their journeys but also highlights a 13% cheaper premium than the average driver's ($1,759).
» Average commute time in Cleveland: 25 minutes
8. Cincinnati, OH
| 🚘 Discount Driving Cincinnati is another city with great insurance rates. Drivers in Cincy have an average annual insurance premium of $1,334, 24% less than the average U.S. driver's $1,759. |
Cincinnati residents spend 16% of their income on their commute annually, an impressive 11% less than the U.S. average (18%). Drivers also defy the clock, losing a mere 11 hours to traffic each year — 78% fewer hours than the nationwide average (51).
Yet, the true win lies in the dollars saved. Cincinnati commuters retain their earnings, losing only about $4,455 in potential income every year because of their commutes. This contrasts with the $5,209 burden the average U.S. driver carries.
» Average commute time in Cincinnati: 25 minutes
9. Minneapolis, MN
| 🏎️ Turbocharged Commutes Drivers in Minneapolis lose just 26 hours on average to traffic every year. That’s 49% fewer hours than the average American driver spends in traffic (51). |
With a public transit score of 55 out of 100, Minneapolis outshines the average transit score (42%) in other cities by 15%. But that's just one facet of Minneapolis's transportation landscape. In the Twin Cities area, 13.1% of workers opt for the convenience of remote work — 35% more than the average rate of 9.7%.
Minneapolis also has high-quality roads. Although 17.4% of major roads in the average U.S. metro area bear the scars of neglect, Minneapolis counters with a mere 3.7% of major roads in poor condition — a staggering 79% less.
» Average commute time in Minneapolis: 25 minutes
» Read more stats on Minnesota
10. Richmond, VA
| 🪴 Home, No Honks In Richmond, 11.9% of residents work from home — 10% more remote workers than the average U.S. city (23%). That's good news for those trying to escape DMV traffic. |
Drivers in Richmond enjoy a remarkable advantage, losing just 23 hours annually to traffic's grip — 55% less than the average American (51). They’re also not losing out on income as much as other Americans. Their annual commute-related income loss is just $4,867. That’s 7% less than the $5,209 the average U.S. commuter loses.
As a beacon of progress, only 9.8% of major roads in Richmond are in poor condition, a stark contrast to the 17.4% total for the average American city.
» Average commute time in Richmond: 25 minutes
» Read more stats on Virginia
11. Pittsburgh, PA
| 🚆 Easy Riders In Pittsburgh, 4.7% of commuters use public transit to get to work, 12% more than the U.S. overall (4.2%). Pittsburgh’s public transit system features over 100 routes and includes a bus line, light rail, and incline system. |
Pittsburgh drivers savor their hours, losing just 34 hours annually to the clutches of traffic. That’s 33% fewer hours than the average American loses (51). This may be because 10.8% of Pittsburgh's workers embrace the freedom of remote work — 11% more than the average U.S. city (9.7%).
Although Pittsburgh has a reputation for having a confusing highway system, the city is at least in good shape. Only 14.7% of major roads in Pittsburgh are in poor condition, a striking 16% fewer than the average metro (17.4%).
» Average commute time in Pittsburgh: 27 minutes
» Read more stats on Pennsylvania
12. Portland, OR
| 🧘 Remote & Relaxation Portland is another WFH hub. In the City of Roses, 14.4% of residents work from home. That's 50% more than the 9.7% U.S. average. |
Portland is one of the more expensive cities in the country, but maintenance costs for the average driver amount to a savvy $369 annually, 19% less than the national average ($458). The city isn't just dominated by drivers, however. Another 5% of Portland's commuters embrace public transit instead — 19% more than the U.S. average (4.2%).
Back to the roads: Only 11.1% of major roads in Portland are considered in poor condition. That’s 36% less than the national average of 17.4%. Talk about a smooth trip!
» Average commute time in Portland: 26 minutes
» Read more stats on Oregon
13. Virginia Beach, VA
| 🍃 Breezin’ Down the Highway That ocean breeze comes with less traffic. Virginia Beach drivers lose just an average of 12 hours to traffic every year, compared to the average U.S. driver, who loses 51 hours. That's 76% fewer hours. |
Virginia Beach commuters spend a modest $629 on fuel, cruising confidently beneath the U.S. average of $763. But that's only the beginning.
With maintenance costs amounting to approximately $395 annually, drivers in Virginia Beach spend 14% less than the national average ($458). They also lose a mere $4,153 in potential income each year — 20% less than the $5,209 the average U.S. driver loses.
» Average commute time in Virginia Beach: 25 minutes
14. Louisville, KY
| ⭐ Gold-Star Roads Just 10.9% of roads in Louisville are in poor condition. That’s 38% fewer than the average U.S. city, which has nearly 20% of roads in rough shape! |
Commuters in Louisville spend an average of $632 on fuel every year, which is 17% less than the national average of $763. This may be because their traffic is better than most American cities. Louisville drivers lose just 11 hours to traffic every year, 78% less than average (51).
They’re also saving more money than other Americans. In Louisville, commuters lose just $3,859 in potential income every year to their commutes — 26% less than the national average of $5,209.
» Average commute time in Louisville: 24 minutes
» Read more stats on Kentucky
15. Austin, TX
| 👩💻 In Remote Company Austin has grown as a tech hub in the past several years, so it's no surprise that 16.8% of Austin workers work from home — 73% more than the 9.7% in the U.S. overall. |
Austin commuters spend a mere $679 on fuel — 11% less than the average U.S. commuter’s $763. Yet, the city's allure extends far beyond the fuel gauge.
Austin commuters fare better than others when it comes to maintaining their vehicles, with costs of $447 annually — 2% below the national norm of $458. Its roads are kept in check, too. A mere 9.5% of major roads bear signs of wear and tear. That’s 45% less than the nation's average of 17.4%.
» Average commute time in Austin: 28 minutes
» Read more stats on Texas
Best Cities for Commuters by Category
The 10 Worst Cities For Commuters
Every city can't be the best for workers on the go. Of the 50 most-populous metros, the following 10 are the least favorable for commuters:
- Houston, Texas
- Chicago, Illinois
- Atlanta, Georgia
- Los Angeles, California
- Riverside, California
- Detroit, Michigan
- Miami, Florida
- Dallas, Texas
- New York, New York
- Philadelphia, Pennsylvania
Commuters in the bottom 10 spend, on average, around 23% of their income on their commute every year. That's 26% more than the average U.S. commuter spends (18%). Commuters in the bottom 10 also spend, on average, $892 on fuel to commute every year – 17% more than the U.S. average ($763).
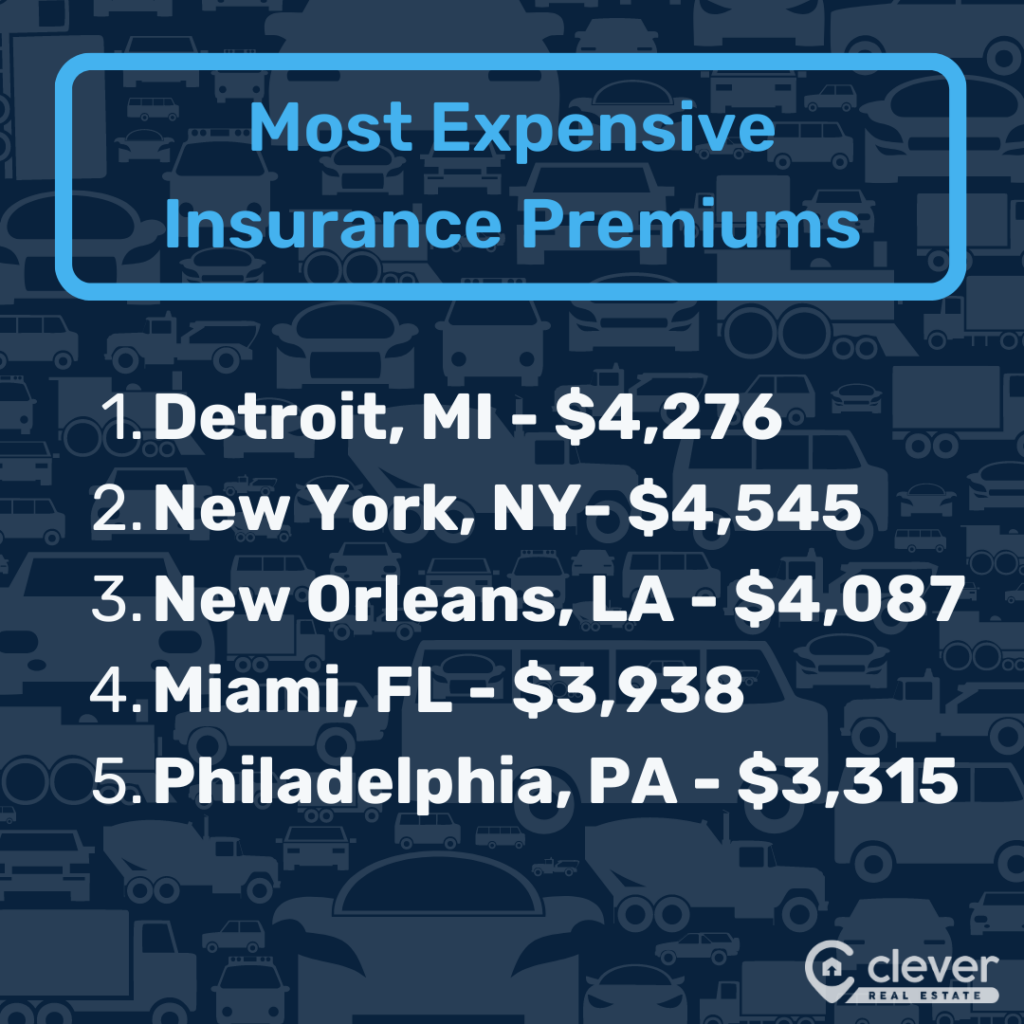
They're also paying more for insurance premiums. Drivers in the bottom 10 have an average annual insurance premium of $3,038 — 73% more than the average American ($1,759).
Interestingly, New York is one of the worst cities for commuters but the best when it comes to public transportation. NYC just isn't a great city for those commuting by car, but it is the best city for commuting by public transportation, with a transit score of 89 out of 100 and 27.8% of workers using public transit to commute to work.
The worst city for commuters overall is Houston, where the average worker spends $933 on fuel – 22% more than the U.S. average ($763). Houston roads also suffer. About 17.4% of major roads in urbanized areas across the U.S. are of "poor" quality. In Houston, however, 26.7% of major roads are in poor condition — 53% more than average. Houston also has a poor public transit score of 36 out of 100, compared to the average score of 42 among all 50 cities in our study.
Public Transit Rankings
Robust public transit systems are an important feature of a metro that is suitable for commuters. In urban areas, some commuters don't even own a vehicle and thus travel by public transit the majority of the time.
The study's main focus is on car commuters, but it also aims to recognize metropolitan areas where the majority of workers either don't use cars or where strong public transit systems effectively serve the workforce.
We ranked cities based on two public transit-related metrics: their transit score via Walkscore.com and the percent of workers who use public transit to commute. The percentage of workers who use public transit to commute is weighted more heavily than the transit score.
New York City is the best city for public transit, not surprising to anyone who has visited or lived there. New Yorkers live in one of the few American cities where residents can get around fairly easily without a car. New York City also has a substantial bus system, but using the train system alone is sufficient for many residents.
| Public Transit Rank | Metro | % of Public Transit Commuters | Transit Score (out of 100) |
| 1 | New York, NY | 27.8 | 89 |
| 2 | San Francisco, CA | 13.8 | 77 |
| 3 | Boston, MA | 10.7 | 72 |
| 4 | Washington, DC | 10.1 | 69 |
| 5 | Chicago, IL | 10 | 65 |
| 6 | Philadelphia, PA | 7.9 | 67 |
| 7 | Seattle, WA | 7.9 | 60 |
| 8 | Baltimore, MD | 5 | 53 |
| 9 | Pittsburgh, PA | 4.7 | 55 |
| 10 | Portland, OR | 5 | 49 |
| 11 | Los Angeles, CA | 4.1 | 53 |
| 12 | Minneapolis, MN | 3.6 | 55 |
| 13 | Miami, FL | 2.6 | 57 |
| 14 | Denver, CO | 3.3 | 45 |
| 15 | Hartford, CT | 2.4 | 53 |
| 16 | Buffalo, NY | 2.8 | 47 |
| 17 | Milwaukee, WI | 2.5 | 49 |
| 18 | San Jose, CA | 3.3 | 40 |
| 19 | Salt Lake City, UT | 2.8 | 44 |
| 20 | Providence, RI | 2.1 | 47 |
| 21 | Atlanta, GA | 2.4 | 44 |
| 22 | Cleveland, OH | 2.4 | 44 |
| 23 | New Orleans, LA | 2 | 44 |
| 24 | Las Vegas, NV | 2.7 | 36 |
| 25 | San Diego, CA | 2.4 | 37 |
| 26 | St. Louis, MO | 1.7 | 43 |
| 27 | Cincinnati, OH | 1.4 | 44 |
| 28 | Richmond, VA | 1.3 | 42 |
| 29 | Houston, TX | 1.8 | 36 |
| 30 | Sacramento, CA | 1.9 | 34 |
| 31 | Phoenix, AZ | 1.4 | 36 |
| 32 | Austin, TX | 1.5 | 35 |
| 33 | Dallas, TX | 1 | 39 |
| 34 | Detroit, MI | 1.2 | 36 |
| 35 | Orlando, FL | 1.2 | 33 |
| 36 | San Antonio, TX | 1.4 | 31 |
| 37 | Columbus, OH | 1.3 | 30 |
| 38 | Louisville, KY | 1.5 | 27 |
| 39 | Tampa, FL | 1 | 31 |
| 40 | Riverside, CA | 1 | 30 |
| 41 | Charlotte, NC | 1.3 | 27 |
| 42 | Raleigh, NC | 0.7 | 29 |
| 43 | Virginia Beach, VA | 1.4 | 21 |
| 44 | Indianapolis, IN | 0.8 | 25 |
| 45 | Kansas City, MO | 0.8 | 25 |
| 46 | Jacksonville, FL | 1 | 21 |
| 47 | Nashville, TN | 0.8 | 22 |
| 48 | Memphis, TN | 0.5 | 22 |
| 49 | Birmingham, AL | 0.4 | 21 |
| 50 | Oklahoma City, OK | 0.4 | 17 |
Top 15 for Public Transit
- New York, New York
- San Francisco, California
- Boston, Massachusetts
- Washington, D.C.
- Chicago, Illinois
- Philadelphia, Pennsylvania
- Seattle, Washington
- Baltimore, Maryland
- Pittsburgh, Pennsylvania
- Portland, Oregon
- Los Angeles, California
- Minneapolis, Minnesota
- Miami, Florida
- Denver, Colorado
- Hartford, Connecticut
On average, 7.9% of workers in the top 15 cities use public transportation, 88% more than the average American city (4.2%). These areas also showcase an average transit score of 61 out of 100, surpassing the study's metro average (42) by 45%.
Notably, in New York City, an extraordinary 27.8% of workers use public transit for commuting, 7x more than the U.S. average (4.2%). Additionally, NYC earns an impressive public transit score of 89, which exceeds the study's metro average (42) by 112%.
Bottom 10 for Public Transit
- Oklahoma City, Oklahoma
- Birmingham, Alabama
- Memphis, Tennessee
- Nashville, Tennessee
- Jacksonville, Florida
- Kansas City, Missouri
- Indianapolis, Indiana
- Virginia Beach, Virginia
- Raleigh, North Carolina
- Charlotte, North Carolina
On average, just 1% of workers in the lowest-ranking 10 cities for public transit actually use it, 77% less than the U.S. average (4.2%) These cities also have an average transit score of 25 out of 100, which falls 40% below the study's metro average (42).
For instance, in Oklahoma City, our worst city for public transit, a mere 0.4% of workers use public transit for commuting, a substantial 90% drop from the U.S. average. Additionally, OKC's transit score is notably low at 17, indicating a 60% difference from the study's metro average (42).
Annual Time Spent & Cost of Commuting Calculator
Methodology
Clever Real Estate compared the 50 most-populous U.S. metro areas across nine metrics, listed below. Each metric was normalized and graded on a 100-point scale. The combined weighted average of each score determined the overall “commuting city” score upon which the final ranking was based.
Data points were attributed to metropolitan areas as much as possible. For some, data attributed to the largest city in the metropolitan area was used.
The metrics used are as follows:
- Annual hours lost to traffic (15.4%)
- Public transit score (11.5%)
- Percentage of workers who work from home (11.5%)
- Annual cost of commuting as a percentage of annual income (7.7%)
- Annual fuel cost to commute (7.7%)
- Annual maintenance cost to commute (7.7%)
- Average annual insurance premium (7.7%)
- Average time to work (minutes, one way) (7.7%)
- Percentage of workers who commute by public transit, excluding taxis (7.7%)
- Average distance of a commute in miles (3.8%)
- Opportunity cost of commuting (3.8%)
- Estimated average mph achieved during commute (3.8%)
- Percentage of major road miles in "poor" condition (3.8%)
Here's how we defined our metrics:
Fuel: We estimated the cost of fuel by calculating the gallons of gas used to commute to work by dividing the average distance to work by the average miles per gallon across all light-duty vehicles (22.9 MPG) then multiplied that by the average gas price per gallon.
Maintenance: The cost of maintenance was calculated as the average cost of maintenance per mile (10 cents) multiplied by the average number of miles to work.
Opportunity: We estimated the opportunity cost of a person’s time as the amount of money they could have earned had they been working instead of commuting by multiplying the average hourly wage by the number of hours spent commuting to work.
Percent of income: We calculated the total cost to commute by adding the fuel, maintenance, insurance, and opportunity costs together. We then divided that by the median annual income to determine how much of a worker's annual income is attributable to annual commute costs.
Sources: U.S. Bureau of Labor Statistics, the U.S. Department of Transportation Federal Highway Administration, the U.S. Census, the American Automobile Association, the Brookings Institute, INRIX, GasBuddy, The Zebra, and Walkscore.com
About Clever
Since 2017, Clever Real Estate has been on a mission to make selling or buying a home easier and more affordable for everyone. About 12 million annual readers rely on Clever's library of educational content and data-driven research to make smarter real estate decisions, and to date, Clever has helped consumers save more than $160 million on Realtor fees. Clever's research has been featured in The New York Times, Business Insider, Inman, Housing Wire, and many more.
More Research from Clever Real Estate
American Home Buyer and Seller Report (2023 Edition): To learn how buyers and sellers are navigating this bizarre new market, we surveyed 1,000 Americans who purchased a home in 2022 and 2023.
The Most Bike-Friendly Cities in the U.S. (2023 Data): We ranked the most bike-friendly cities in the U.S. based on bicycling commuters, bike shops, and more.
1 in 4 Americans Think Marriage Is an Outdated Concept in 2023: We surveyed 1,000 adult Americans about their views on marriage, their relationship deal breakers, and other topics related to the institution.
Other Articles from Clever Real Estate
11 Best Companies That Buy Houses for Cash: Looking to sell your home fast? We found the best companies that buy houses for cash.
Home Buyer Rebates: Do You Qualify?: Are home buyer rebates legal? Yes, 42 states and Washington, D.C., allow agents and brokers to offer rebates or cash rewards to home buyers.
The Best Low Commission Realtors and Brokers (2023 Update): Find out who the best low commission real estate brokers are in 2023, including Clever, Redfin, and more.
Frequently Asked Questions
How long is a healthy commute?
Emerging research indicates that lengthy commutes to work can have adverse effects on one's health. Commutes over 2 miles were correlated with physical inactivity, poor sleep quality, and more.
How long of a commute is too long of a commute?
Surprisingly, just over 2 miles of commuting is associated with negative health impacts. However, the average American commutes about 27 minutes one way to work. Learn more.
Is 45 minutes a normal commute?
A 45-minute commute is significantly above average in the U.S., where the typical one-way commute is 27 minutes. Learn more.
Is 90 minutes too long for a commute?
Ninety minutes one way is above the average U.S. commute time, which is 27 minutes. Learn more.