
| 🏆 Where are the most bike-friendly cities in the U.S.? 🏆America's most bike-friendly city is Minneapolis, followed by Portland, Oregon, and San Francisco. |
Most Bike-Friendly Cities, Ranked | 15 Most Bike-Friendly Cities | Rankings by Category
| 10 Least Bike-Friendly Cities | Methodology | FAQs
In a modern world with an abundance of fast, motorized options for transportation, the humble bicycle is experiencing a boom not seen in the U.S. since the 1970s.
Americans rediscovered the bicycle during the pandemic as they looked for safe, socially distant forms of exercise, recreation, and transportation. Bike sales surged, and retailers struggled to keep up with demand.
Three years later, Americans are still pedaling in high gear while other pandemic fads have fallen flat. In 2022, U.S. consumers spent $8.2 billion on bicycles and accessories — up from $6.9 billion in 2020.
Cycling is fun, healthy, and good for the environment, but it can be a perilous pastime depending on a city's infrastructure. Many motorists assume the streets were made for them, although cyclists were actually the first people to lobby cities for paved roads.
Some cities, however, are shifting away from a car-centric transportation model by adding designated bike lanes, building off-road bike paths, and increasing access to bike-sharing options.
To determine the most bike-friendly cities in America, we evaluated multiple metrics, including:
- 5x: The bikeability of the metro area based on Walk Score's bike score.
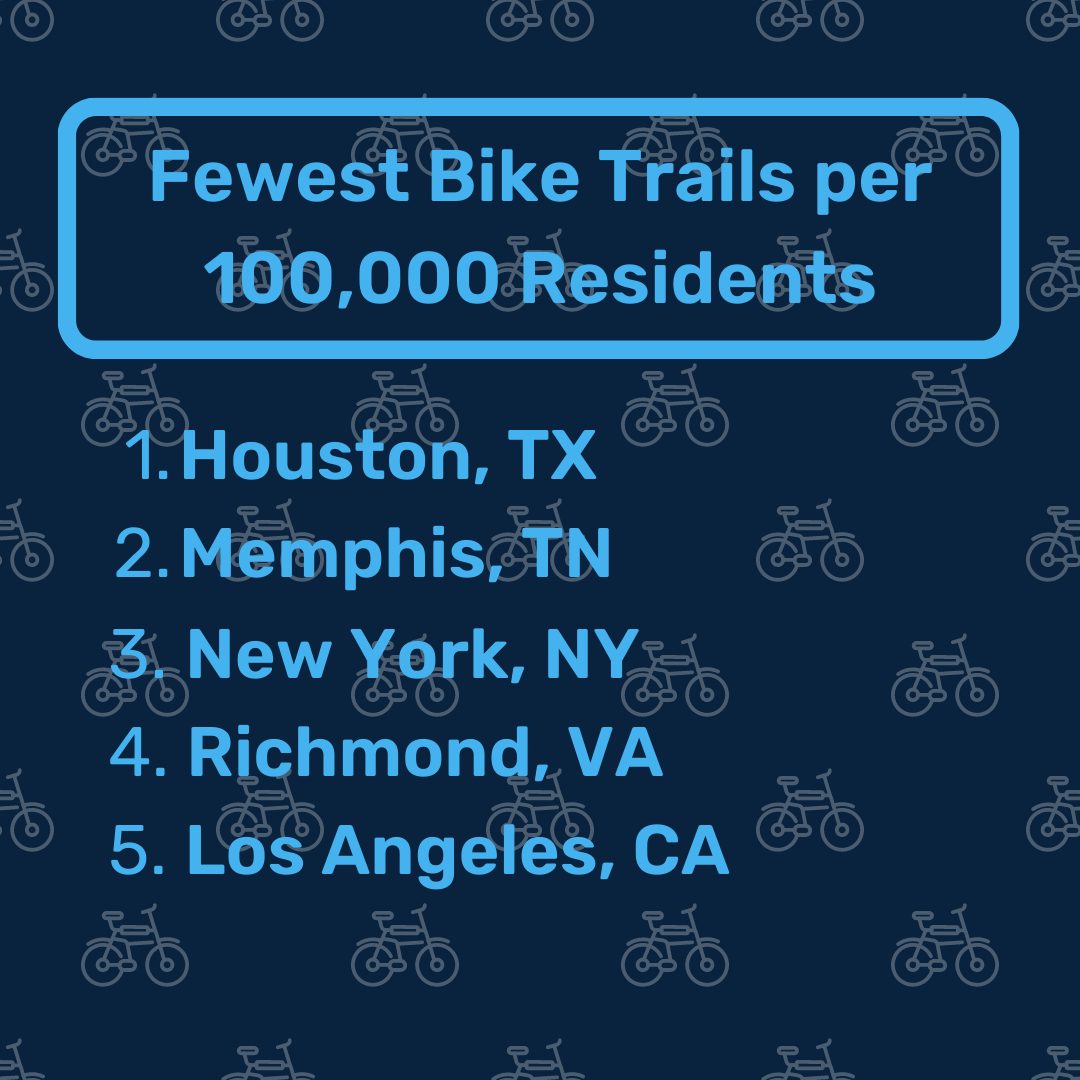
- 5x: The number of bike trails per 100,000 residents, emphasizing access to non-road bike areas.
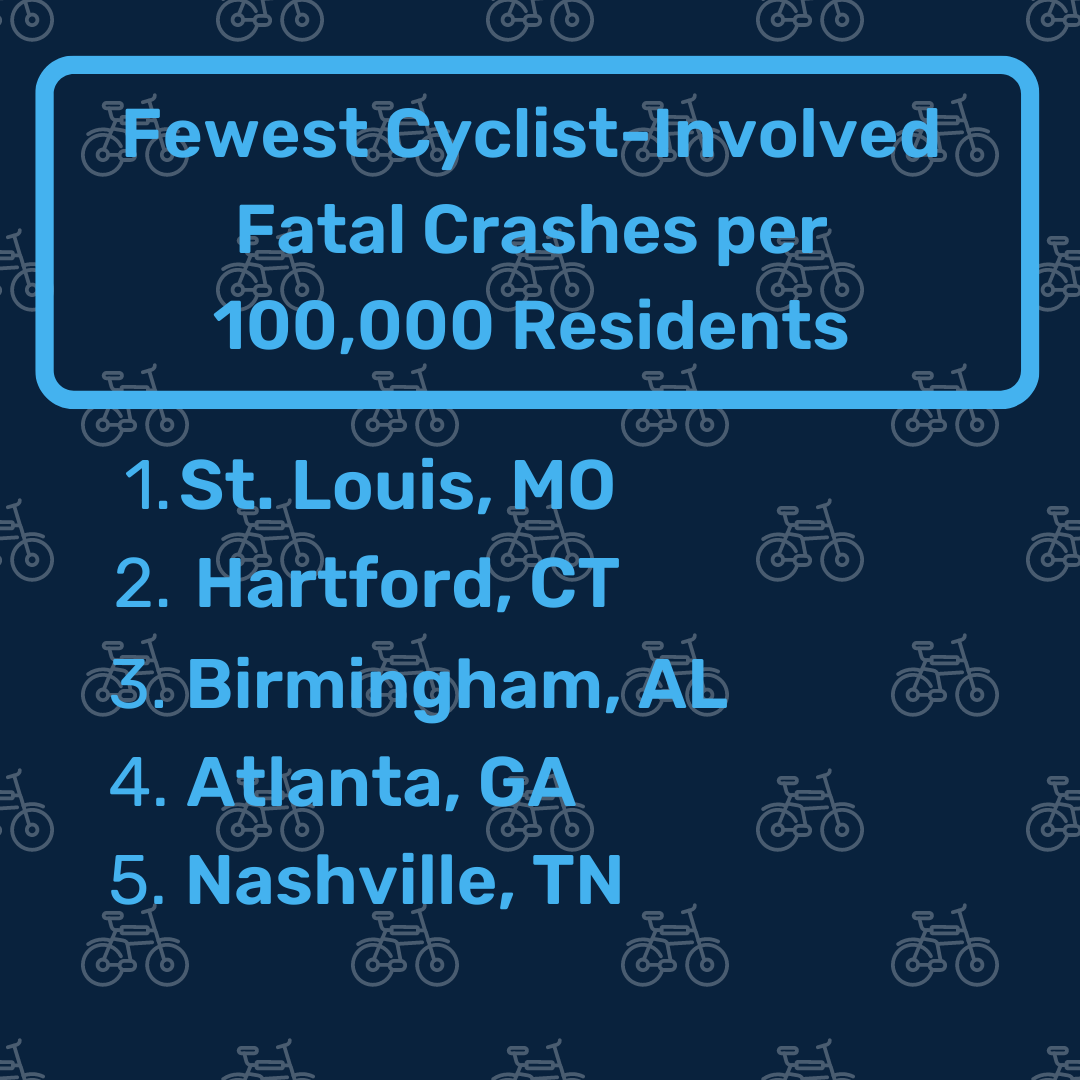
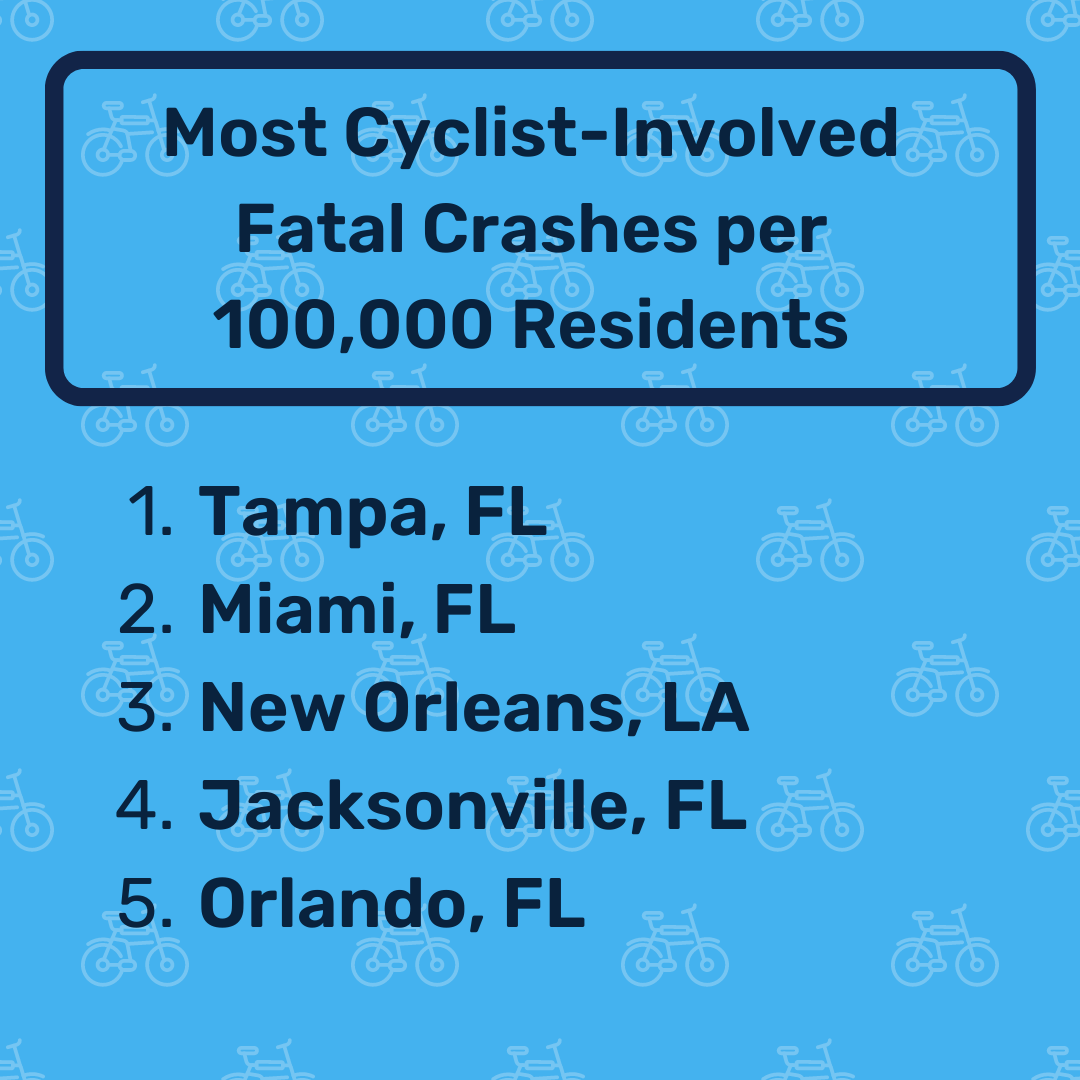
- 4x: The number of cyclists involved in fatal motor vehicle crashes in 2021 per 100,000 residents.
- 3x: The number of bike shops per 100,000 residents, including bike repair locations.
- 3x: The number of bike share docking stations per 100,000 residents.
- 2x: The number of bike rental shops per 100,000 residents.
- 2x: The number of days the metro has a moderate air quality index score of above 50 but below 100. Below 50 is considered "good," and lower values are ranked higher.
- 1x: The number of wet weather days per year. Lower values are ranked higher.
- 1x: Total search volume for 10 bicycle-related search terms, such as "biking," "cycling," and "bike trails," on Google.
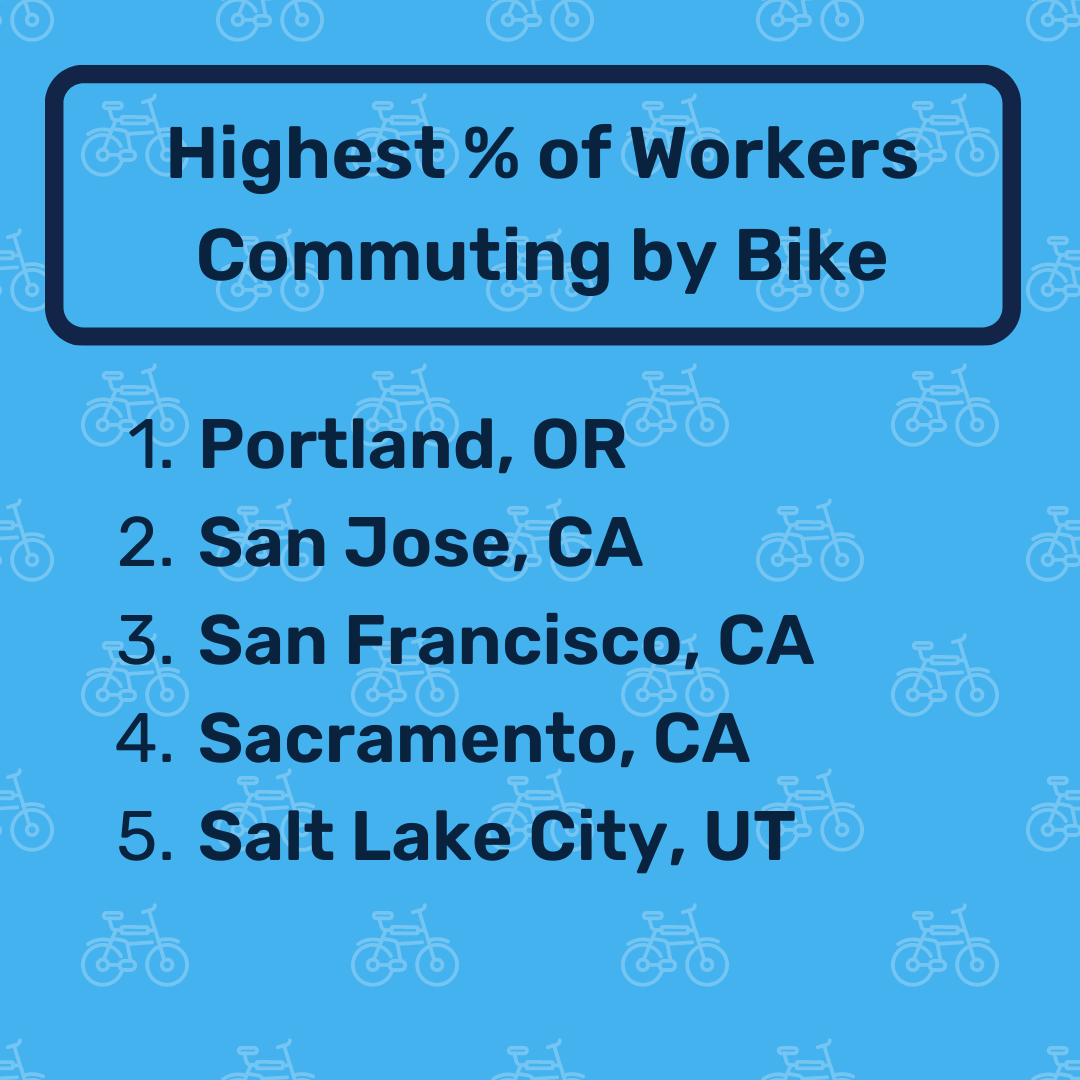
- 1x: The percentage of workers who commute by bicycle. A higher percentage may act as an indicator of bicycle-friendly transportation infrastructure.
- 1x: Commitment to Vision Zero, a nonprofit campaign helping communities commit to transit and bicycle safety with the goal of eliminating traffic fatalities and injuries.
For a full list of metrics, see the methodology section.
Keep reading to find out if your city is geared toward cyclists or poses a wheel problem.
🚲 Most Bike-Friendly Cities in the U.S. Statistics
|
The 50 Most Bike-Friendly Cities, Ranked
The 15 Most Bike-Friendly Cities in the U.S.
1. Minneapolis, Minnesota
| 🥇 A Schwinner’s MindsetMinneapolis improved upon its No. 4 rank in 2022 to knock off Portland as this year's most-bike friendly city in the U.S. |
Minneapolis may be a frozen tundra for half the year, but it's a hotbed for two-wheeled travel. Less-than-ideal weather conditions haven't stopped Minneapolis cyclists, who are some of the most zealous in the country. With a passion score of 68 out of 100 — the third-highest score on our list — Minneapolis residents search for bike-related terms on Google 72% more than residents in other cities.
The city is known for its sizable network of bike paths, which includes 98 miles of bike lanes and 101 miles of off-street bikeways and trails— the most popular of which is the 5.5-mile Greenway converted from out-of-use railroad infrastructure. Overall, the city boasts 2.6 bike trails per 100,000 residents, which is 42% more than the studied city average (1.8).
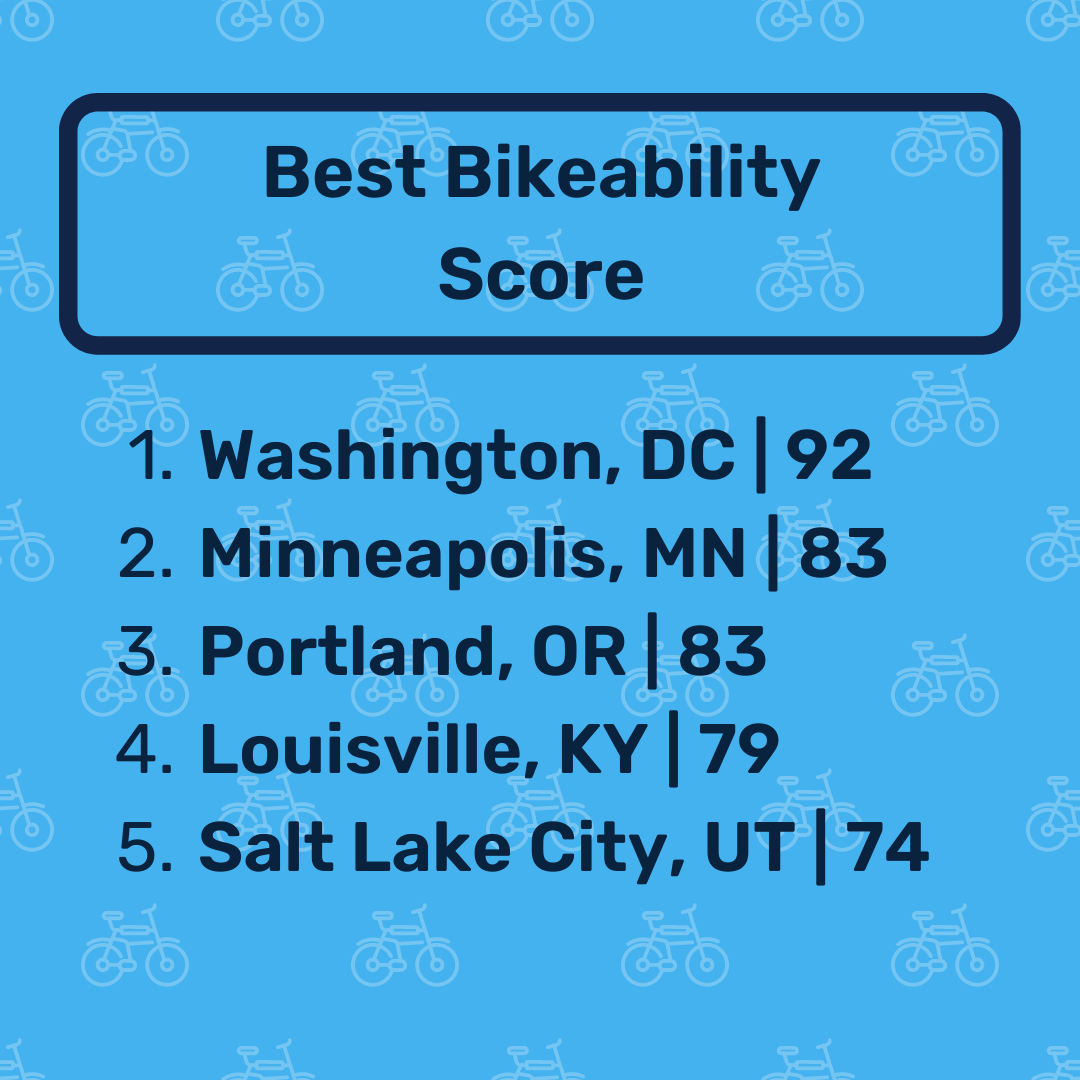
Decades of work to make streets more accessible has led to one of the highest bikeability rankings among all 50 cities studied. Minneapolis is tied with Portland for the second-highest score — 83 out of 100. But it takes more than well-developed bike infrastructure to get residents into the saddle. Minneapolis is a leader in increasing access to bikes. Its bike share program provides 10.8 docking stations per 100,000 residents — nearly 4x the studied city average (2.9).
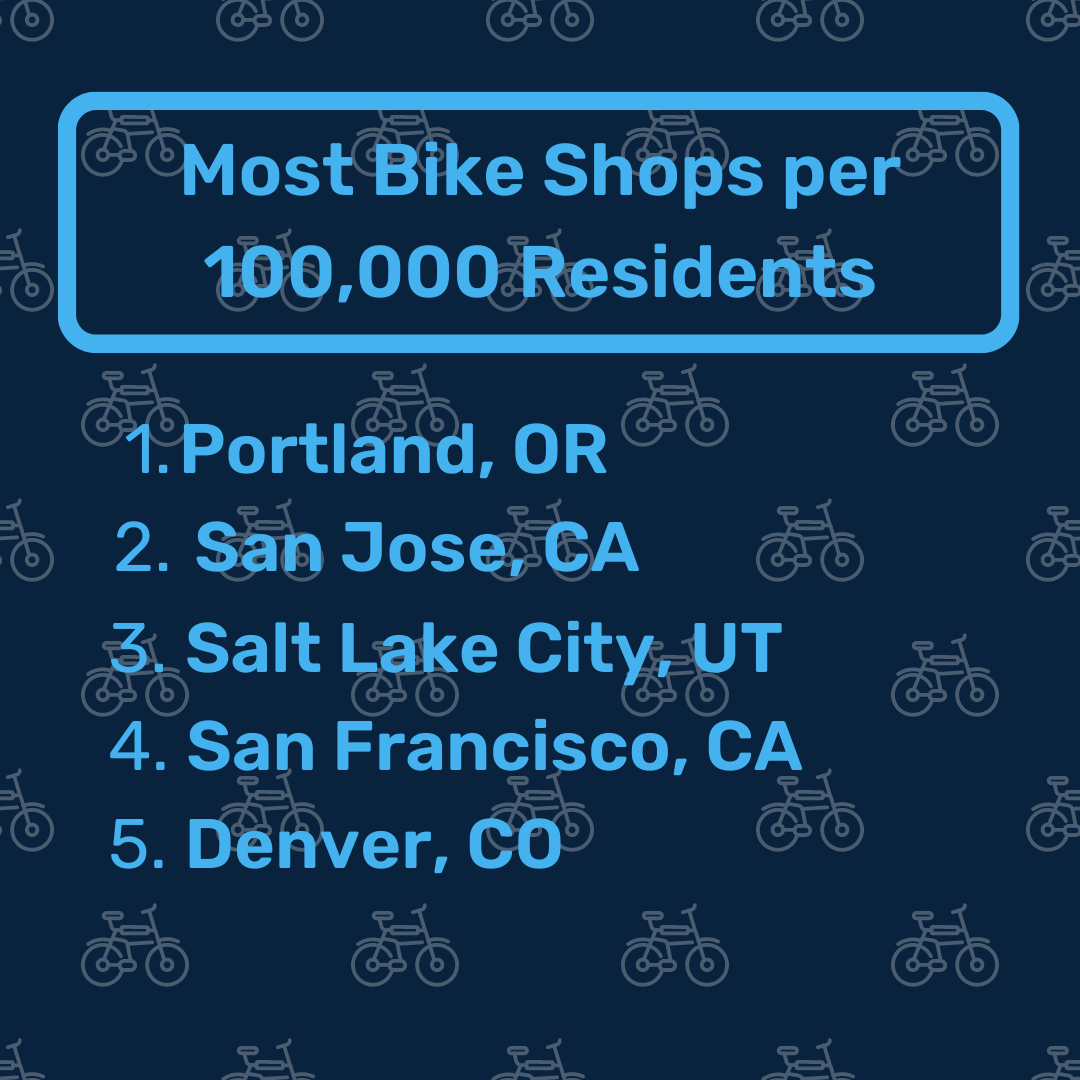
In addition, Minneapolis has 37% more bike shops than the average city, with 1.4 per 100,000 residents. Bike shops and bicycle advocacy groups help power the local economy, producing more than 5,500 jobs and $780 million in economic activity. Naturally, the city lends its full support, collaborating with local businesses and nonprofits on numerous car-free, open-streets events that cultivate a tight-knit cycling community.
» Read more stats on Minnesota
2. Portland, Oregon
| 🥈 Pedal Pushers Portland has the highest percentage of employees who commute by bike, with 1.1% cycling to work — 2.75x more than the studied city average (0.4%). |
In 1895, The Oregonian published a story titled "Reign of the Wheel:
The Present Passion for the Bicycle Likely to Hold Out." The article has aged remarkably well. More than 100 years later, Portland is still a bike town with an enthusiastic base of supporters. Of the 50 most-populous metros, Portland ranks No. 8 for bicycle passion, with local residents searching the web for bike-related terms 33% more often than residents in other cities.
Portland's bike community is nurtured through a number of community events, including the monthslong Pedalpalooza festival featuring hundreds of themed rides. It's easy to join in on the fun without spending a lot of money through Portland's bike share program, Biketown. The program provides a fleet of
1,000 bikes and 9 docking stations per 100,000 residents — 3x the number in the average city (2.9).
There are plenty of opportunities to rent a bike in Portland, but cyclists who want to own their own wheels will find the highest concentration of bike shops per capita among the 50 largest U.S. metros. Portland sports 3.5 bike shops per 100,000 residents — 3x the number in the average city (1.1).
Portland is one of the best places to cycle recreationally, but it's also a legitimate form of daily transportation. With more than 160 miles of bike lanes, 94 miles of neighborhood greenways, and 85 miles of bike paths, the city has earned a bikeability score of 83 out of 100, compared to the national average of 56. Safe street infrastructure has resulted in just 0.12 fatal crashes involving cyclists per
capita — about 61% fewer than in the average city (0.31).
Although Portland is certainly pedaling ahead of the pack, Minneapolis outperformed it in many key metrics, including trails and bike share docking stations per capita. What's more, the city is experiencing a puzzling decline in bicycle ridership, causing it to slip from last year's top position.
» Read more stats on Oregon
3. San Francisco, California
| 🥉 The Bronze Pedal San Francisco has 9.8 bike share docking stations per 100,000 residents — nearly 3.5x the number in the average city (2.9). |
California is the most bike-friendly state for cyclists with three cities in the top 15, but San Francisco breaks away from the pack. The city boasts a whopping 460 miles of total bike lanes and 2.2 trails per 100,000 residents — 21% more than in the average city (1.8). With such a developed bike network, it's no surprise San Francisco has earned a bikeability score of 72 out of 100.
Ongoing infrastructure investments make biking to work a safe and convenient option for many employees, and about 1% of residents commute to the office by bike. That's the second-highest percentage on our list and 2.5x more than the studied city average (0.4%).
San Franciscans enjoy some of the best biking infrastructure in the country thanks to powerhouse advocacy groups that have worked for decades to make the city more bike-friendly. The oldest group, the San Francisco Bicycle Coalition, organizes community events and partners with the city to provide in-class and on-road safety courses. The result is 44% fewer fatal crashes involving cyclists in San Francisco than in the average city.
Bay Area bikers show a massive interest in cycling, ranking No. 4 in overall online search activity for bike-related terms. Specifically, San Francisco residents rank No. 2 in Google searches for "bike lanes," "cycling," and "bicycle." To meet such high demand for wheels, San Francisco has 2x more bike shops and 2.5x more bike rental shops than the average city.
» Read more stats on California
4. Boston, Massachusetts
| ↗️ No BackpedalingBiking in Boston has gotten even better. The city improved to No. 4 on our list after ranking No. 8 in 2022. |
Boston may be best-known for its marathon, but cycling has a long and rich history in Beantown. The United States' first recreational bicycle club was founded in Boston in 1878, and since then, bike riders have only grown more passionate — searching the web for bike-related terms 12% more often than residents in other cities.
The Boston cycling community is active in organizing meetups and events, such as the now-famous Midnight Ride of the Boston Marathon course on the eve of the race. Boston offers plenty of recreational opportunities for cyclists, but it has also developed its transit network to promote sustainable transportation.
Boston officials hope to encourage 0.8% of employees to bike to work by 2030. With seven years to go, the city has almost achieved its goal. About 0.7% of Boston employees currently commute to work by bike — 75% more than the studied city average (0.4%). But the city isn't taking chances and is building additional bike infrastructure to ensure it meets its objective.
With 59 miles of off-street paths and 17.5 miles of separated bike lanes, the city has earned a bikeability score of 69 out of 100, compared to the national average of 56. But there are gaps in the network that can cause accidents. Although Boston has 67% fewer cyclist-involved fatal crashes than the average city, harmful collisions still happen.
In August 2022, activists from the Boston Cyclist Union formed a human bike lane during the morning commute to advocate for completion of the bike network. A few weeks later, the mayor announced the city would add 9.4 miles of new bike lanes by the end of 2023. Once completed, 35% of all Boston residents will live within a three-minute walk of the bike network.
Residents can roll through the growing bike network on one of the city's many rental bikes. With 8.9 bike share docking stations per capita — 3x the number in the average city (2.9) — it's easy to access a bike from nearly anywhere in the city.
» Read more stats on Massachusetts
5. Washington, D.C.
| 🤪 Cycle-paths The District is tied with Minneapolis for the most bike share docking stations per capita, with 10.8 per 100,000 residents. That's nearly 4x more than the studied city average (2.9). |
The U.S. capital wasn't always a bike-friendly city, but local officials began pushing the pedal forward in 2010 when they piloted the country's first bike share program. Known as Capital Bikeshare, the program provides easy access to bicycles in its ever-expanding network of docking stations, which grew 9% from 2022 to 2023. The goal is for every resident to live within a quarter-mile of a docking station.
Around the same time that Capital Bikeshare launched, the city began developing its cycling infrastructure. Since then, the District has built more than 100 miles of bike lanes and installed nearly 2,000 bike racks. The investment in infrastructure has earned the District a bikeability score of 92 out of 100 — the highest mark among all 50 cities studied.
By building infrastructure that makes streets safer, the city has the 10th-lowest cyclist-involved fatal crash rate in the country. The District records 0.13 fatal crashes involving cyclists each year — 59% fewer than the national average (0.31).
City officials hope prioritizing safety will encourage residents to hop on a bike more often. For new cyclists, there are a number of groups, such as DC Bike Party and Nice-N-Easy, that will welcome them to the community. Whether they're new or experienced cyclists, D.C. residents are passionate about biking and search for bike-related terms on Google 28% more than those in other cities.
6. Salt Lake City, Utah
| 🚴 Life Behind BarsSalt Lake City has 2.5x more bike shops than the average city, with 2.7 per 100,000 residents — the third-highest number on our list. |
Ranked No. 9 in our 2022 report, Salt Lake City has worked tirelessly to become a more bike-friendly city. The Folsom Trail and a number of others were completed last year, resulting in a 6% increase in trails per capita from 2022. Now, residents enjoy 3.3 bike paths per 100,000 residents — 80% more than in other cities (1.8).
Salt Lake City cyclists can traverse the bike network with relative ease thanks to a top-five bikeability score of 74 out of 100 — 32% higher than the national average (56). That's led to 23% fewer fatal crashes involving cyclists and an increase in the number of residents who feel comfortable biking to work.
From 2022 to 2023, the percentage of Salt Lake employees who commuted by bike rose from 0.6% to 0.7% — the fifth-highest rate on our list. Meanwhile, some students are even hopping on the trend and cycling to school by "bike bus."
Promoting sustainable forms of transportation is a priority for the city to counteract increasing pollution, which manifests in 140 days a year of poor air quality. To get Salt Lakers rolling, the city's bike share program, GREENbike, provides 3.9 docking stations per 100,000 residents — 34% more than in the average city (2.9). The city also has 35% more bike rental shops than the average metro, with 0.6 per capita.
» Read more stats on Utah
7. San Jose, California
| 💻 Cycology 101San Jose cyclists aren't the type to coast on their own knowledge. With a passion score of 67 out of 100, they search the web for bike-related terms 71% more than residents in other cities. |
San Jose is a notoriously expensive and sprawling city, resulting in long commutes and increased air pollution. As a possible solution to these problems, city officials are shifting their focus to bicycles as a low-cost and low-carbon way to traverse the city. Since 2009, the city has built 400 miles of on-street bike lanes and nearly 3,500 bike parking spaces, earning the city a bikeability score of 62 out of 100, compared to the national average of 56.
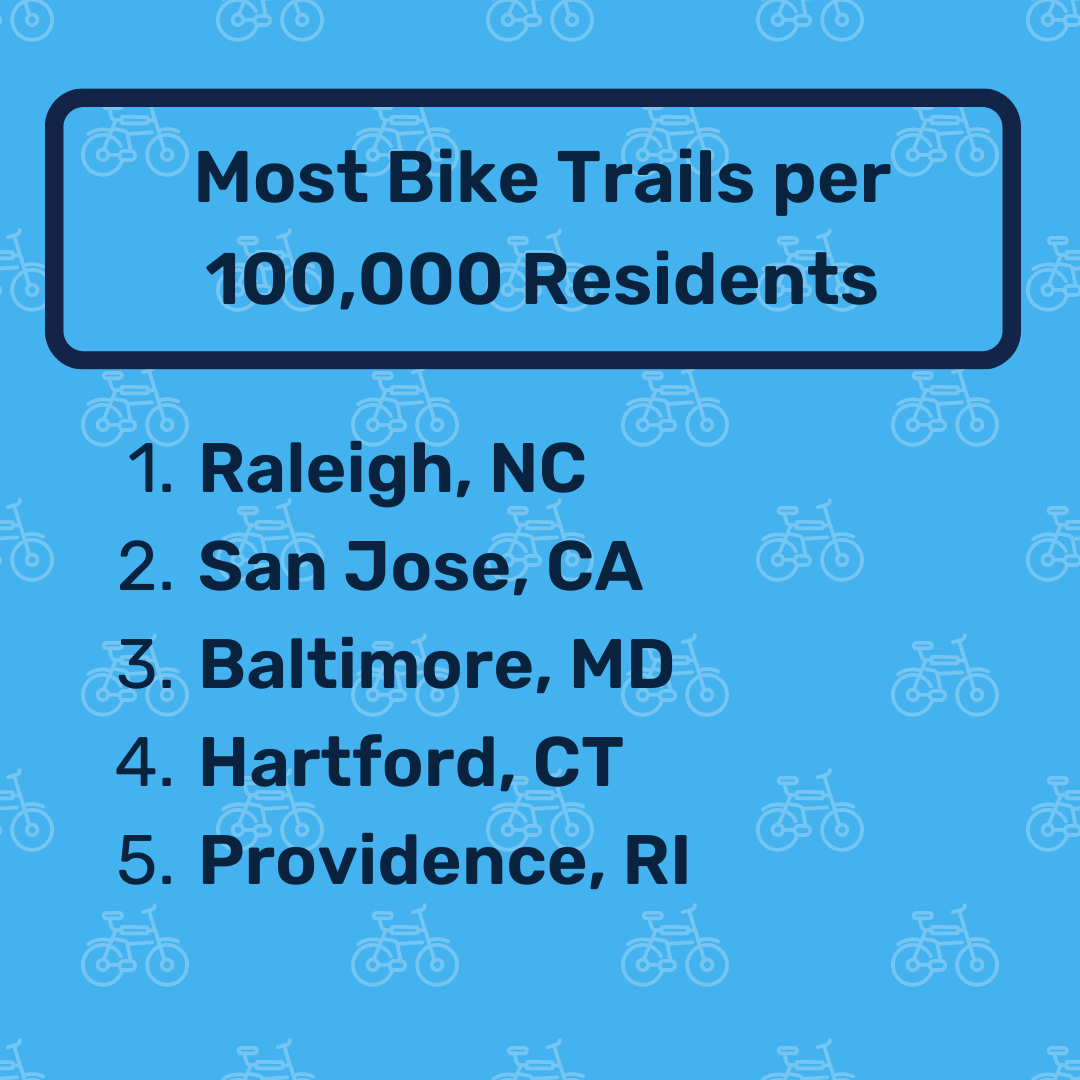
San Jose already has the second-highest concentration of trails on our list, with 4.2 per 100,000 residents — 2.5x more than the average city (1.8). But the local government isn't stopping there. By 2025, the Better Bike Plan calls for 100 additional miles of protected bike lanes.
City officials hope the upgrades will encourage more residents to increase their non-car trips throughout the city. About 1% of San Jose employees regularly ride their bike to work — 2.5x more than the national average — but the city has an ambitious goal of increasing that percentage to 20% by 2050.
To do that, the city has made accessing a bike easy and affordable through participation in the Bay Wheels bike share program, which provides 3.1 bike share docking stations per 100,000 residents. What's more, San Jose has 2.5x more bike shops (2.8 per 100,000 residents) than the average city (1.1).
8. Denver, Colorado
| 🚵♀️ Ride the RockiesDenver residents are passionate about cycling culture, ranking No. 1 in Google search activity for bike-related terms. |
Colorado may be best known as a skiing and hiking destination, but it's also one of the best places in the U.S. to cycle. In Denver, there are 3.5 bike trails per 100,000 residents — about 2x more than the average number across all cities studied (1.8).
Cyclists ready to hit the trails will have no trouble accessing a bike in Mile High City. With 2.3 bike shops and 0.6 bike rental shops per 100,000 residents, Denver has 115% and 36% more retailers than the average city, respectively.
Denver has plenty to offer recreational cyclists, but it also accommodates those who want to bike for transportation. About 0.6% of employees commute to work by bike, and the transit system has grown to meet those needs. The city has built 137 miles of new bike infrastructure in the past five years, exceeding the goal of 125.
Advocates, such as the Bike Denver Initiative and the Denver Bicycle Lobby, continue to push for more high-comfort bike lanes with physical barriers to reduce rising fatalities. But with a steadfast commitment to the Vision Zero network, Denver still has 24% fewer cyclist-involved fatalities than the average city.
Support for safe cycling and a commitment to building bike infrastructure has earned Denver a bikeability score of 72 out of 100, much higher than the average score of 56 across all cities studied.
» Read more stats on Colorado
9. Seattle, Washington
| 🛞 The Wheel DealSeattle boasts 1.8 bike shops per 100,000 residents — 71% more than the average among all 50 cities studied (1.1). |
Seattle might not seem like an ideal city for cyclists with its hilly landscape and infamous rainy season, but this city is a tour de force in the biking community. Despite the geographical challenges, about 30% of Seattle's roughly 733,000 residents ride their bikes regularly. With a score of 58 out of 100, the city's bicycle base is passionate about cycling culture and searches the web for bike-related terms at the sixth-highest rate among all cities studied.
Seattle utilizes innovative bike lane design with plenty of physical barriers, leaning rails, and bike-specific traffic signals — earning the city a bikeability score of 71 out of 100, compared to 56 nationwide. Additionally, the Vision Zero commitment is taken seriously, and Seattle has just 0.12 cyclist-involved fatal crashes per 100,000 residents — about 60% less than the average city (0.31).
» Read more stats on Washington
10. Providence, Rhode Island
| ❗️ Spoke-tacularWith 3.7 bike paths per 100,000 residents, Providence has more than double the number of trails as the average city (1.8). |
In 2020, former Providence mayor and avid cyclist Jorge Elorza implemented the Great Streets Initiative, which aimed to increase mobility through 43 miles of new trails, 22 miles of neighborhood greenways, and 6 miles of upgrades to existing bike lanes.
With help from local advocates, such as RI Bike, results of the ambitious plan are starting to show. Providence is one of the most-improved bike cities on our list, rising 13 spots from No. 23 in 2022 to No. 10 in 2023.
Cycling can be an expensive hobby, but the state is working to make it more affordable by offering rebates to residents who purchase e-bikes. For casual cyclists who don't want to bust their budgets, Providence is a top-five city for bike rental shops, with 1 per 100,000 residents.
Additional bike infrastructure will be a boon to those bike businesses as more residents have access to safe bike paths nearby. With just 0.12 cyclist-involved fatal crashes, Providence is already the seventh-safest bike city on our list, but the city reiterated its commitment to safe streets by joining the Vision Zero network in 2022.
» Read more stats on Rhode Island
11. Hartford, Connecticut
| 🚗 Sharing the RoadHartford is one of the safest cities for cyclists with just 0.08 fatal bike accidents per 100,000 residents — the fewest among all cities in the top 15. |
Hartford has made significant progress in becoming more bike-friendly, jumping 13 spots from No. 24 in our 2022 study. But biking has yet to gain a lot of traction in Hartford. Overall, locals search for bike-related terms on Google 13% less than residents in other cities. However, Hartford residents show a particular interest in "bike tours," ranking No. 3 in online search activity for the term.
With 0.9 bike rental shops per 100,000 residents — nearly double the studied city average (0.47) — it's easy to find a bike in Hartford and take a spin through the city. Cyclists who want to explore off the beaten path will find plenty of trails overlooking picturesque rivers and ravines. Hartford boasts the fourth-largest trail network, with 3.7 trails per 100,000 residents. That's 2x more than the studied city average (1.8).
Hartford cyclists have to contend with 130 days of precipitation each year, but when the skies clear, bike riders enjoy some of the cleanest air in the country. The city ranks No. 5 for air quality, with pollution reaching unhealthy levels just 38 days each year.
» Read more stats on Connecticut
12. Milwaukee, Wisconsin
| 🎶 Get On Your Bikes and Ride!With 1.4 bike shops per 100,000 residents, Milwaukee has 34% more than the average city (1.1). With so many options to choose from, it's no surprise Milwaukee ranks No. 3 in online search activity for the term "bicycle shop." |
Milwaukee has long been home to a vibrant cycling community, with unique bike events at every turn. This year, the city's busy bike schedule includes the return of the clothing-optional As Bare As You Dare bike ride, the Colectivo Coffee Beans Classic mountain bike race, and the Santa Cycle Rampage in which cyclists don Santa suits and take to the streets. But no schedule is complete without the annual Riverwest community event, a 24-hour bike ride that draws about 1,000 cyclists each year.
Who wouldn't want to get in on the action? Those in need of a bike will have no problem finding one around town. Milwaukee's bike share program, Bublr Bikes, provides 6.3 docking stations per 100,000 residents — more than double the average in all 50 metros (2.9). The program also offers adaptive bikes, making cycling more accessible to all riders.
With 3.4 bike trails per 100,000 residents — 88% more than the national average — Milwaukee has trails for extreme cyclers and casual riders alike. The 100-mile Oak Leaf Trail is a local favorite, while the Beerline Trail near the city's old breweries is well suited for shorter trips.
Biking is a popular pastime in Milwaukee, but wheels are also made for working. About 0.3% of Milwaukee employees cycle to work on the city's 160 miles of bike lanes. Cars know how to share the road with bike riders, resulting in 18% fewer fatal crashes involving cyclists than in the average city.
» Read more stats on Wisconsin
13. Raleigh, North Carolina
| ⚙️ Mud, Sweat, and (Bike) GearsRaleigh has more bike trails than any other city in our study, with 4.6 per 100,000 residents. That's more than 2.5x the studied city average (1.8). |
With a bikeability score of just 39 out of 100, Raleigh still has miles to go in making the city more traversable by bike. However, Raleigh has added 53 miles of on-street bike paths in the past five years — including 10 miles in 2022 — and has made progress on the 17-mile Triangle Bikeway that would connect Raleigh, Durham, and Chapel Hill.
In 2023, the BikeRaleigh Plan calls for repaving streets, installing bike racks, building and upgrading bike lanes, adding bike lane separators, and improving pavement markings. Thanks to similar safety upgrades, Raleigh has 33% fewer cyclist-involved fatal crashes than the average city.
Although city governments don't always work in high gear, advocacy groups, such as Oaks and Spokes, have stepped in to help residents envision better transportation solutions. The group has collaborated with the city to organize pop-up traffic lanes and traffic gardens.
Raleigh makes bike access a priority with 0.8 bike rental shops per 100,000 residents — 62% more than the studied city average (0.5). What's more, the Cardinal Bikeshare program provides a fleet of rental bikes with 2.3 docking stations per 100,000 residents spread throughout the city for easy access to the city's many trails.
» Read more stats on North Carolina
14. Sacramento, California
| ⚡️ Pedal PowerAbout 0.9% of Sacramento employees commute to work, the fourth-highest percentage among all 50 cities studied. |
You don't need to be a sprocket scientist to understand why Sacramento is one of the most bike-friendly cities in the U.S. California's capital has a bikeability score of 67 out of 100 and continues to invest heavily in bike infrastructure. The city has numerous ongoing projects and was recently awarded a $5 million grant from the California Transportation Commission to add more protected bike lanes in the midtown and downtown areas.
About 60% of Sacramento residents are interested in traveling by bike but are worried about sharing the road with motorized vehicles, according to research from the city. To allay concerns, the local government offers a free urban bicycle class on a monthly basis to teach cyclists the rules of the road and other safety tips. As a result, Sacramento has just 0.21 cyclist-involved fatal crashes per 100,000 residents — 33%
fewer than the studied city average (0.31).
Local organizations, such as the Sacramento Area Bicycle Advocates, lend additional support to the cycling community by providing safety lights, simple repairs, and bike valet at certain events. Through such efforts, the city has developed a passionate base of bicycle supporters. In fact, Sacramento residents search for bicycle-related terms on Google 35% more often than residents in other cities.
Today's cycling community owes much to early bicycle enthusiasts. In 1896, the Sacramento Wheelmen cycling club laid the cinder foundation for what would become the city's crown jewel, the 32-mile American River Parkway. Now, Sacramento boasts 22% more bike trails than the average city, with 2.2 per 100,000 residents.
15. New York, New York
| 🗽 Spokes-peopleIn their spare time, New Yorkers search for bike-related terms on Google 30% more than residents in other cities. |
With more than 550,000 cycling trips made each day in New York City, biking is an important part of the commuter landscape. New Yorkers are surprisingly good drivers, and the number of fatal crashes involving cyclists (0.14 per 100,000 residents) is 56% fewer than in the
average metro (0.31).
But the sheer number of motorists clogging the roadway and slowing the daily commute make biking a preferable mode of transportation. Approximately 0.7% of New York workers commute by bicycle — 75% more than the studied city average (0.4%).
The commuter crowd enjoys 1,525 miles of bike lanes, and the city is always investing and improving its bicycle infrastructure. That's earned New York a bikeability score of 69 out of 100, compared to the national average of 56.
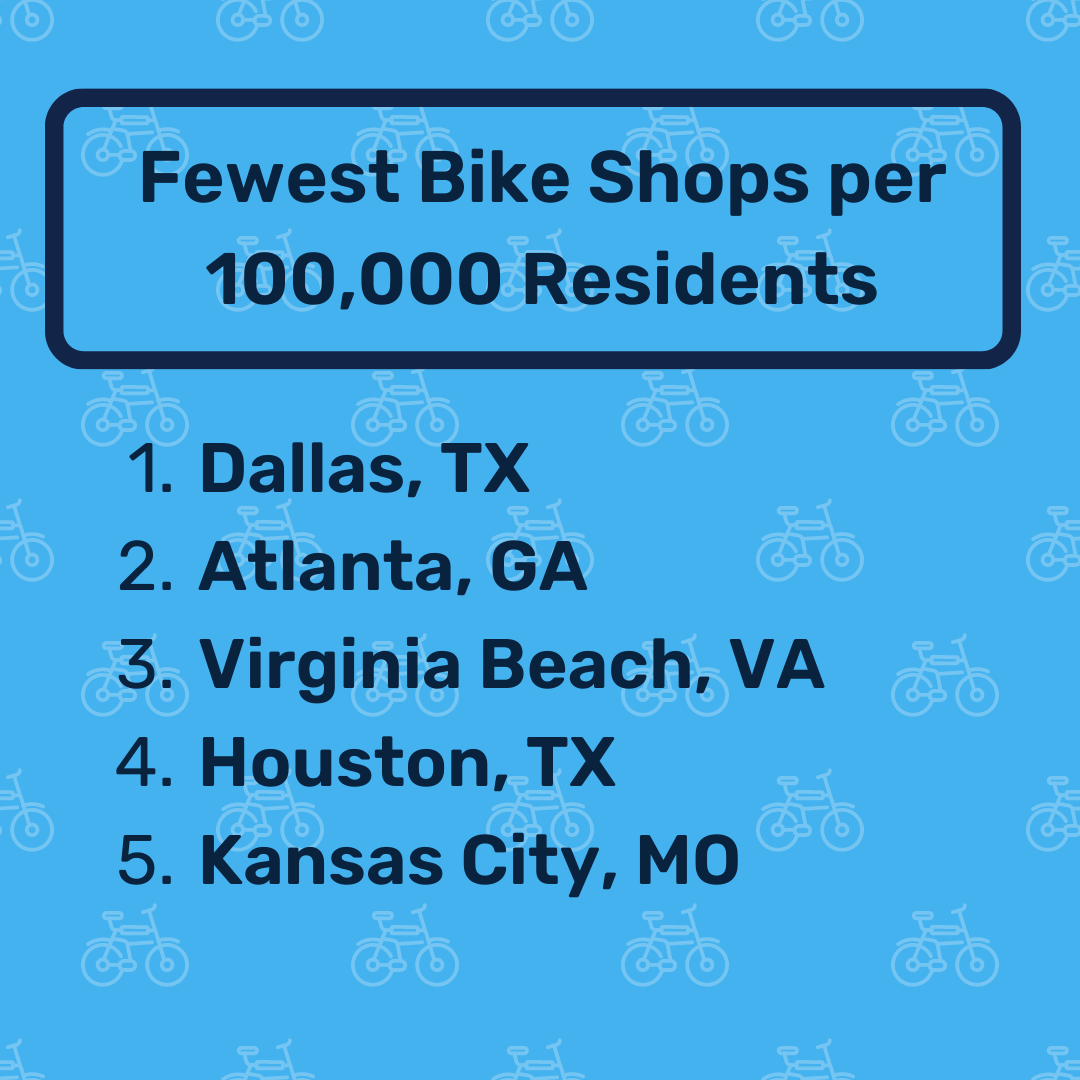
With a slightly below-average number of bike shops per capita, however, New York struggles to meet rising demand for bikes. Luckily, the city's bike share program, Citi Bike, can bridge the gap. New York City boasts 8.6 bike share docking stations per 100,000 residents — nearly 3x more than the studied city average (2.9).
» Read more stats on New York
Rankings by Category
 |
 |
 |
 |
 |
 |
 |
 |
 |
 |
The Least Bike-Friendly Cities in the U.S.
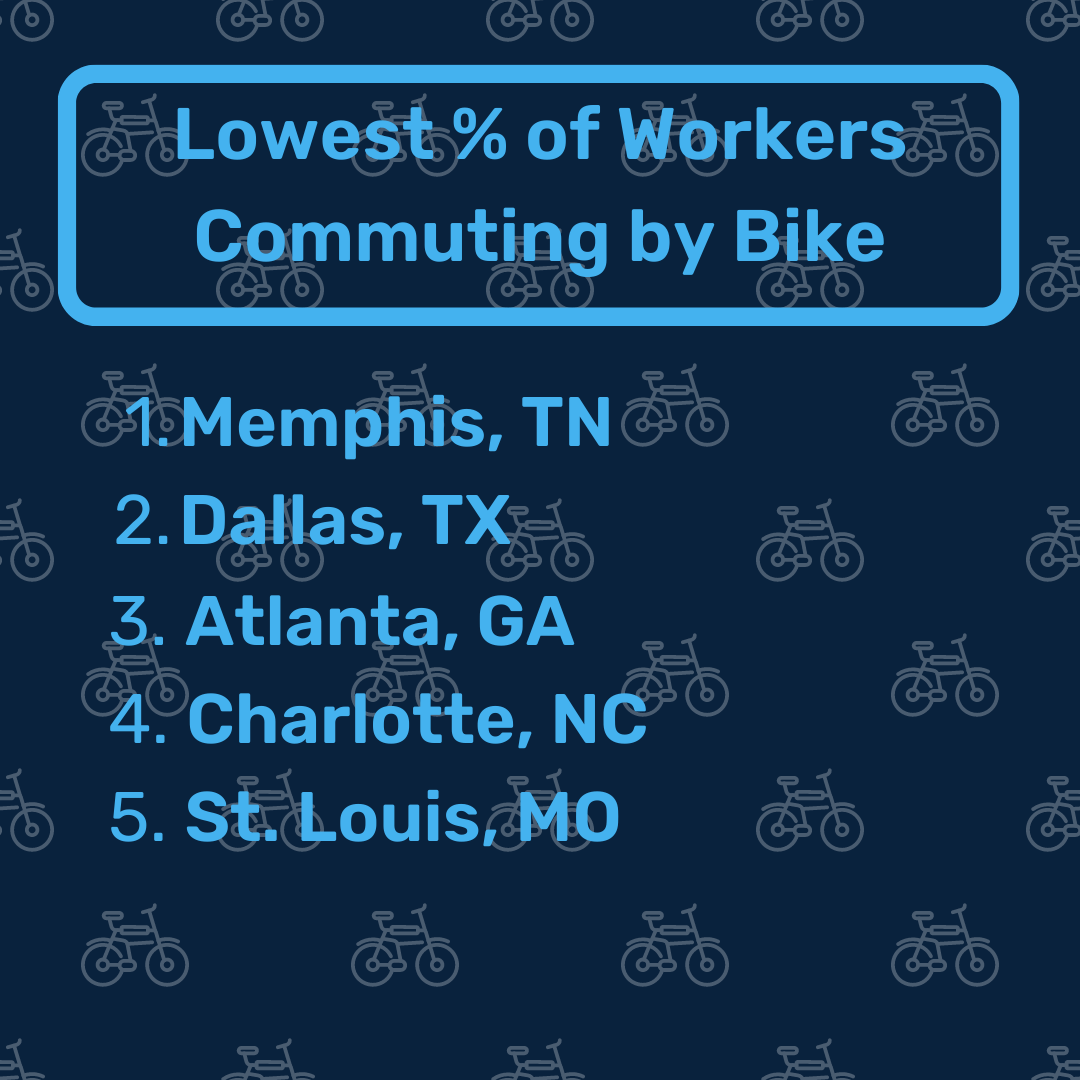
Oh, shift! Some cities can really grind cyclists' gears. Of the 50 most-populous metros, these are the worst 10 for bike riders:
- Memphis, Tennessee
- Houston, Texas
- Riverside, California
- Oklahoma City, Oklahoma
- Phoenix, Arizona
- Jacksonville, Florida
- San Antonio, Texas
- Charlotte, North Carolina
- Virginia Beach, Virginia
- Dallas, Texas
Dallas, the last place finisher in 2022, has made significant progress in becoming more bike-friendly. Rental bikes are returning to Dallas streets after a three-year ban caused the number of bike share docking stations to drop to zero. That number has since increased to 0.8 per 100,000 residents in 2023.
The number of bike trails in Dallas (1.5 per 100,000 residents) has also increased 7% since 2022, with many more scheduled for completion in the coming years. A 50-mile loop trail surrounding the city's urban core is scheduled for completion in 2026, while 4 miles of mountain bike trails and a 66-mile trail connecting Dallas and Fort Worth should be finished by the end of 2023.
Meanwhile, Memphis is losing speed, dropping four spots from its 2022 ranking to replace Dallas as this year's lanterne rouge.
Memphis has a bikeability score of just 41 out of 100, indicating minimal bike infrastructure. The city has added 270 miles of bike lanes since 2010, but cyclists and motorists often struggle to coexist. Memphis has one of the highest cyclist-involved fatal crash rates at 0.37 per 100,000 residents — 21% more than
the average rate of 0.3 in all 50 cities studied.
With such a high death rate, it's perhaps not surprising that residents show little interest in biking. They spend a dismal amount of time searching the web for bike-related terms, resulting in a passion score of just 15 out of 100 — the lowest score on our list.
Lack of interest has made accessing a bike in Memphis more difficult than in other cities. The city has just 0.3 bike rental shops and 2 bike share docking stations per 100,000 residents — 36% and 31% fewer than the average across all cities studied, respectively.
Memphis also lags behind other cities in the number of bike trails within the metro area. With just 0.4 per 100,000 residents, it has 78% fewer bike trails than the average city in our study (1.8).
Methodology
The cities in this study are ranked according to 15 different factors, which were independently weighted and combined to produce our final results. The factors are:
- 5x: The bikeability of the metro area based on Walk Score's bike score.
- 5x: The number of bike trails per 100,000 residents, emphasizing access to non-road bike areas.
- 4x: The number of cyclists involved in fatal motor vehicle crashes in 2021 per 100,000 residents.
- 3x: The number of bike shops per 100,000 residents, including bike repair locations.
- 3x: The number of bike share docking stations per 100,000 residents.
- 2x: The percent of median household income spent on a single comprehensive bike tuneup every year.
- 2x: An average of the high temperatures each metro experiences annually. Lower temperatures are ranked higher.
- 2x: The number of bike rental shops per 100,000 residents.
- 2x: The number of days the metro has a moderate air quality index score of above 50 but below 100. Below 50 is considered "good," and lower values are ranked higher.
- 1x: The number of wet weather days per year. Lower values are ranked higher.
- 1x: An average of the low temperatures each metro experiences annually. Higher temperatures are ranked higher.
- 1x: Total search volume for 10 bicycle-related search terms on Google such as "biking," "cycling," and "bike trails."
- 1x: The percentage of workers who commute by bicycle. A higher percentage may act as an indicator of bicycle-friendly transportation infrastructure.
- 1x: Commitment to Vision Zero, a nonprofit campaign helping communities commit to transit and bicycle safety with the goal of eliminating traffic fatalities and injuries.
- 1x: A Pollfish survey of 1,000 Americans, who identified cities that are the least bike-friendly.
Data sources include the U.S. Census American Community Survey, U.S. Department of Transportation, National Highway Traffic Safety Administration, National Centers for Environmental Information, U.S. Environmental Protection Agency, Vision Zero Network, Google Trends, Traillink.com, Walkscore.com, Biketoworkday.us, and Yelp.
For cities that lacked 2021 data for cyclists involved in fatal crashes, we used 2020 estimates.
About Clever
Since 2017, Clever Real Estate has been on a mission to make selling or buying a home easier and more affordable for everyone. About 12 million annual readers rely on Clever's library of educational content and data-driven research to make smarter real estate decisions—and to date, Clever has helped consumers save more than $160 million on realtor fees. Clever's research has been featured
in The New York Times, Business Insider, Inman, Housing Wire, and many more.
More Research From Clever
Articles You May Like
FAQs
What is America's most bike-friendly city?
Minneapolis is the most-bike friendly city in the U.S. The city is tied with Portland for the second-best bikeability score among the 50 largest U.S. metros, scoring 83 out of 100. With 10.8 bike share docking stations per 100,000 residents, Minneapolis also boasts 4x more than the average city (2.9). Learn more.
Which city is not considered a top U.S. cycling city?
The least bike-friendly city in the U.S. is Memphis, Tennessee, followed by Houston and Riverside, California. Memphis has 21% more cyclist-involved fatal crashes than the average city. The city also has poor bike infrastructure, with just 0.4 bike trails per 100,000 residents — 78% fewer trails than the studied city average (1.8). Learn more.
Where are the best cities for year-round cycling?
San Francisco is the best city for year-round cycling. It's the only city among America's 50 largest metros that has below-average days of wet weather (71), below-average days of poor air quality (83), below-average high temperature (64 degrees), and average low temperature (51 degrees). Learn more.


