

🍩 It's not all about the donuts 🍩
Portland is well-known as the home of the legendary Voodoo Doughnut chain, but it also has an outstanding coffee scene to match. Portland is home to 2.4 coffee roasteries per 100, 000 residents — 255% more than the average city (0.7).
Best Coffee Cities, Ranked | Coffee Calculator | Top 15 Coffee Cities | Best (and Worst) Coffee Cities by Category | 10 Worst Coffee Cities | FAQ
The American coffee market has an estimated value of $11 billion and is expected to grow annually by over 3% in the next five years because of Americans' love for java.
This growth is impressive, despite our research, which indicates that Americans are generally cutting back on buying coffee in coffee shops. We found that 32% of Americans cut back on buying coffee in a cafe in 2023, and another 31% plan to do so in 2024.
Part of the coffee market’s success may be due to an overall increase in prices — not an increase in customers. Coffee prices have gone up since pre-pandemic times, peaking in 2022. Although many Americans say they’re cutting back on coffee excursions, having access to coffee shops is a top 10 quality-of-life factor for Americans scoping out new places to live.
Although local coffee shops are a pivotal component of establishing a city’s unique culture, many Americans still love their national (and international) coffee chains, such as Starbucks, Dunkin’, Peet’s Coffee, and Caribou Coffee.
The top five cities with the most Starbucks lovers based on local search interest are:
- Sacramento, CA
- Los Angeles, CA
- Riverside, CA
- San Diego, CA
- Seattle, WA
The top five cities with the most Dunkin’ lovers are:
- Providence, RI
- Hartford, CT
- Boston, MA
- Baltimore, MD
- Chicago, IL
Unsurprisingly, Dunkin’ gets the most love on the East Coast where it originated, and Starbucks dominates the West Coast.
To find the best cities for coffee lovers overall, we looked at the 50 most populated metros in the U.S. and ranked them based on the following metrics:
- 3x: Coffee shops per 100,000 residents
- 2x: Google Trends score for 15 different coffee-related terms
- 2x: Coffee roasteries per 100,000 residents
- 1x: Average price of a cappuccino
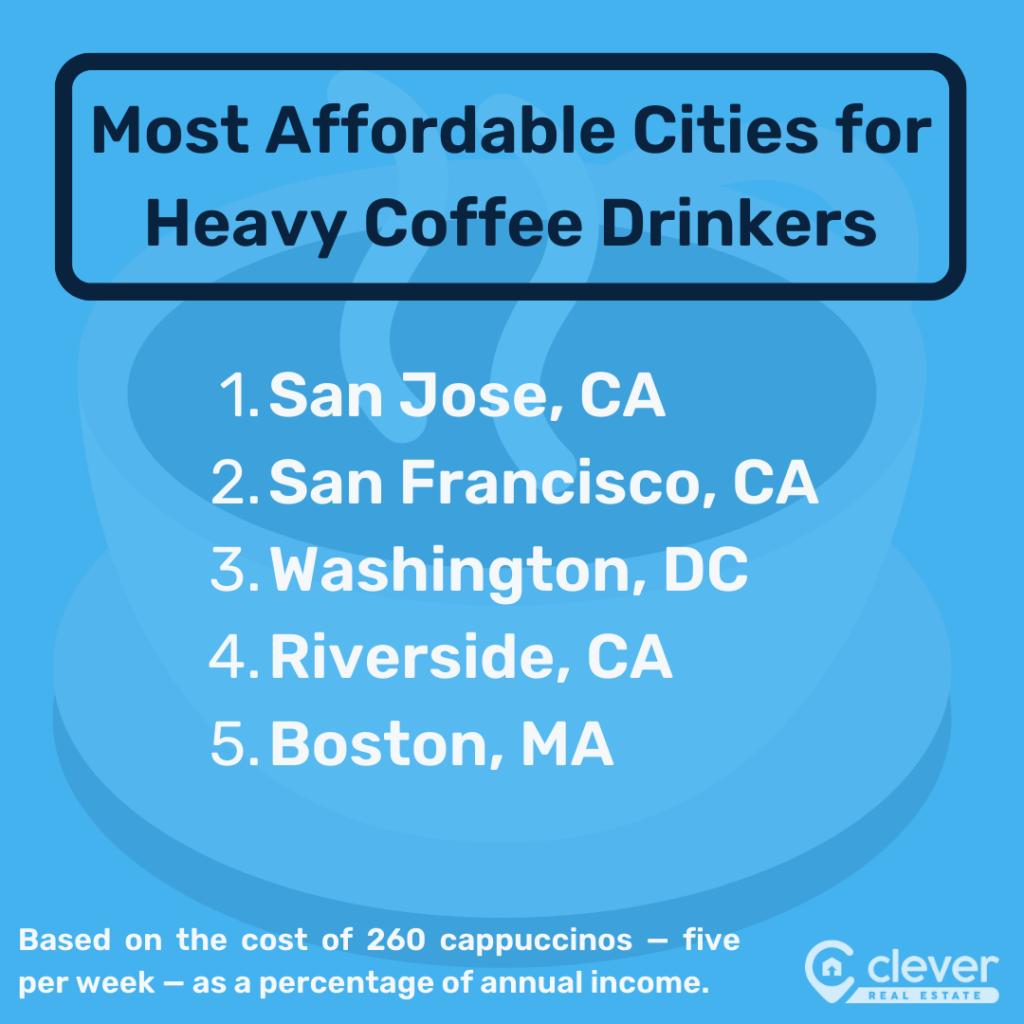
- 1x: Average cappuccino price as a percentage of median income
- 1x: Average Yelp score of local coffee shops
- 1x: Donut shops per 100,000 residents
Best Coffee Cities Statistics ☕
- Portland, Oregon, is the best city for coffee lovers in America. Find out why.👇
- Starbucks is the most popular major coffee chain across the 50 largest American cities, according to Google Trends data, but Dunkin' is more popular in the Northeast.👇
- Kansas City, Missouri, has the highest average Yelp score for its coffee shops at 4.55 out of 5.👇
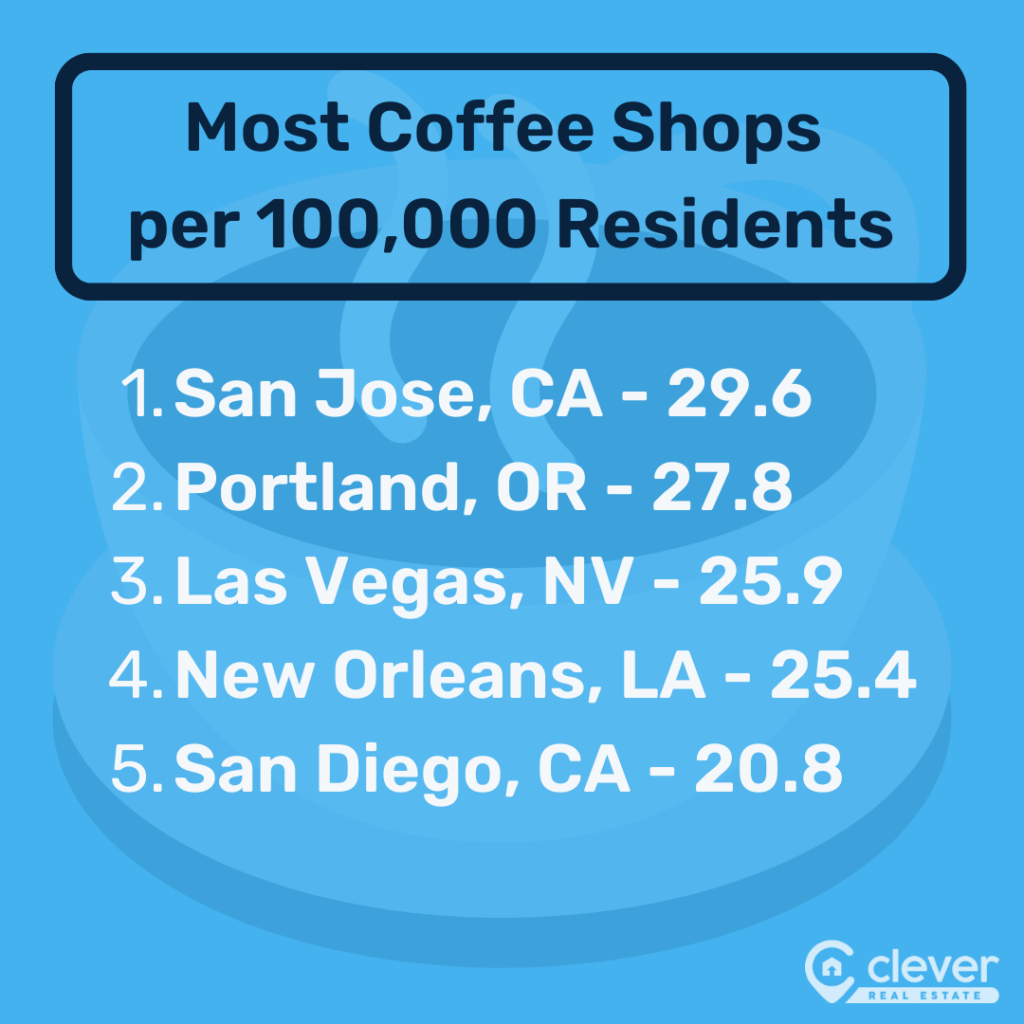
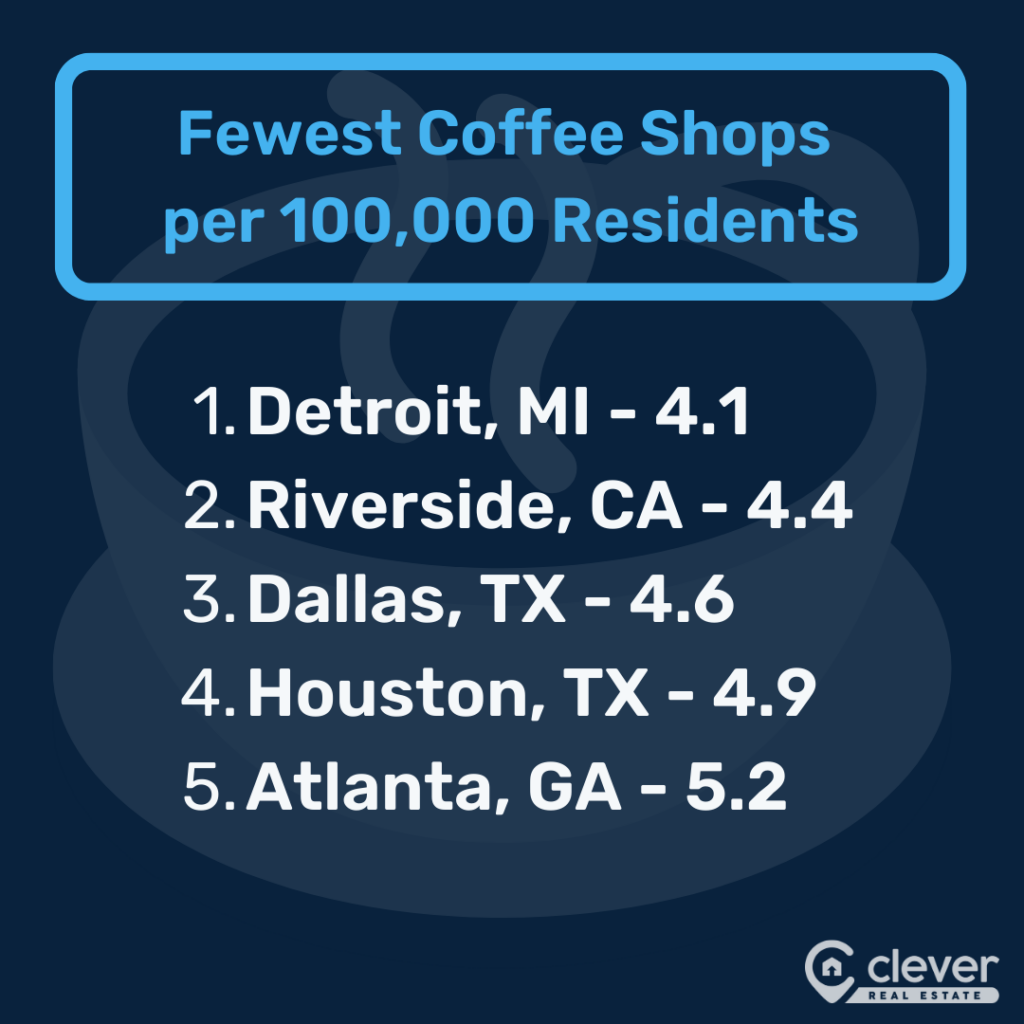
- San Jose, California, has the most coffee shops per capita (12.6 per 100,000 residents), while Detroit has the fewest (4.1).👇
- Providence, Rhode Island, has the most donut shops per capita (8.1 per 100,000 residents), while Miami has the fewest (0.5).👇
- Seattle has the most coffee passion based on Google Trends scores and searches for the most coffee-related terms, scoring a perfect 100.👇
- Houston is the worst coffee city in the U.S.👇
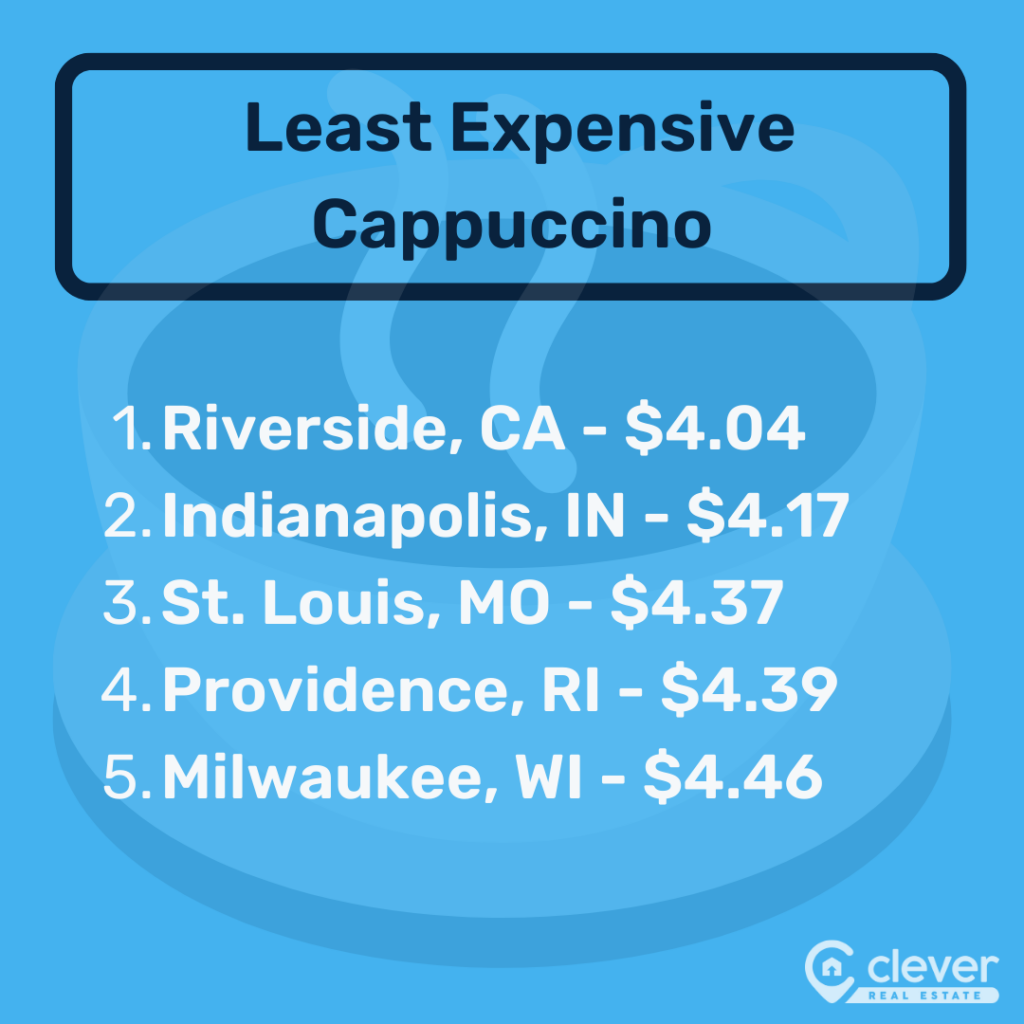
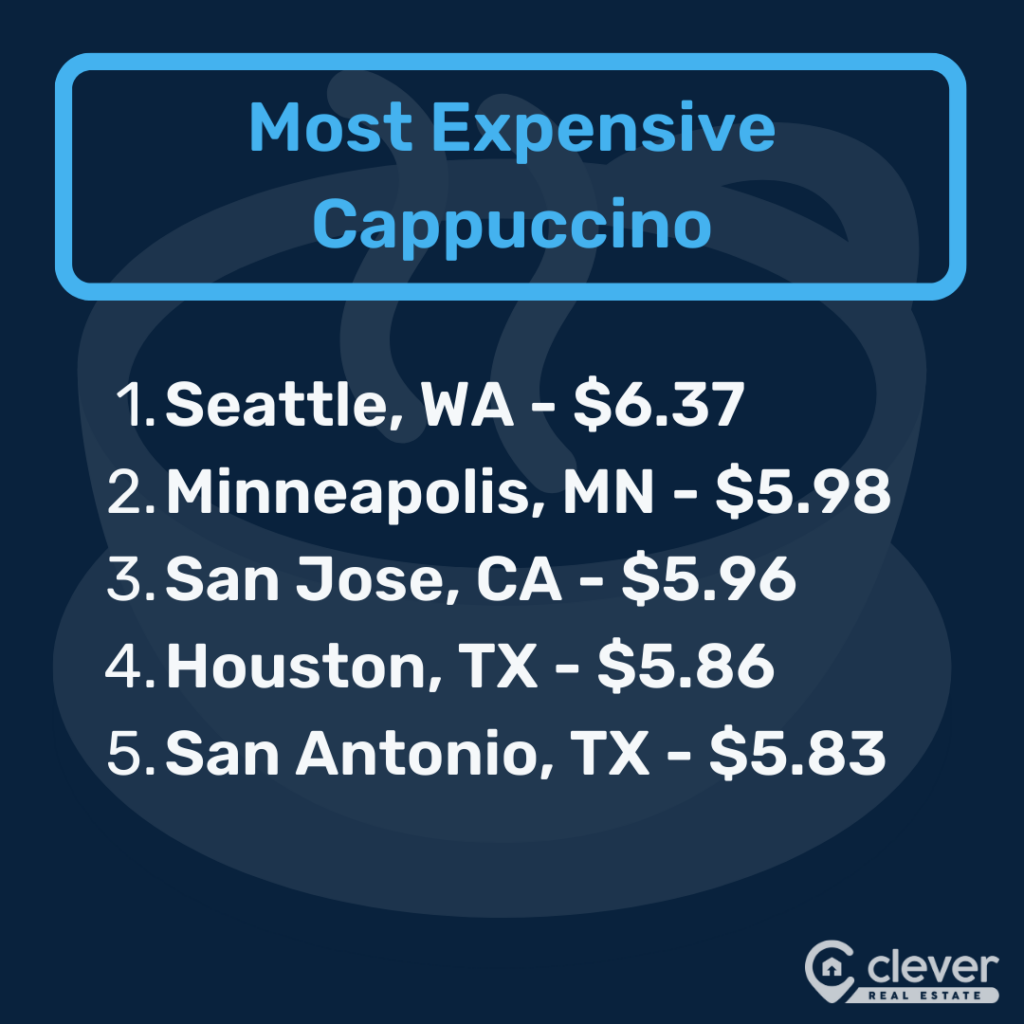
- Seattle has the most expensive coffee, while Riverside, California, has the most affordable. Coffee is $2.33 more expensive on average in Seattle ($6.37) than in Riverside ($4.04).👇
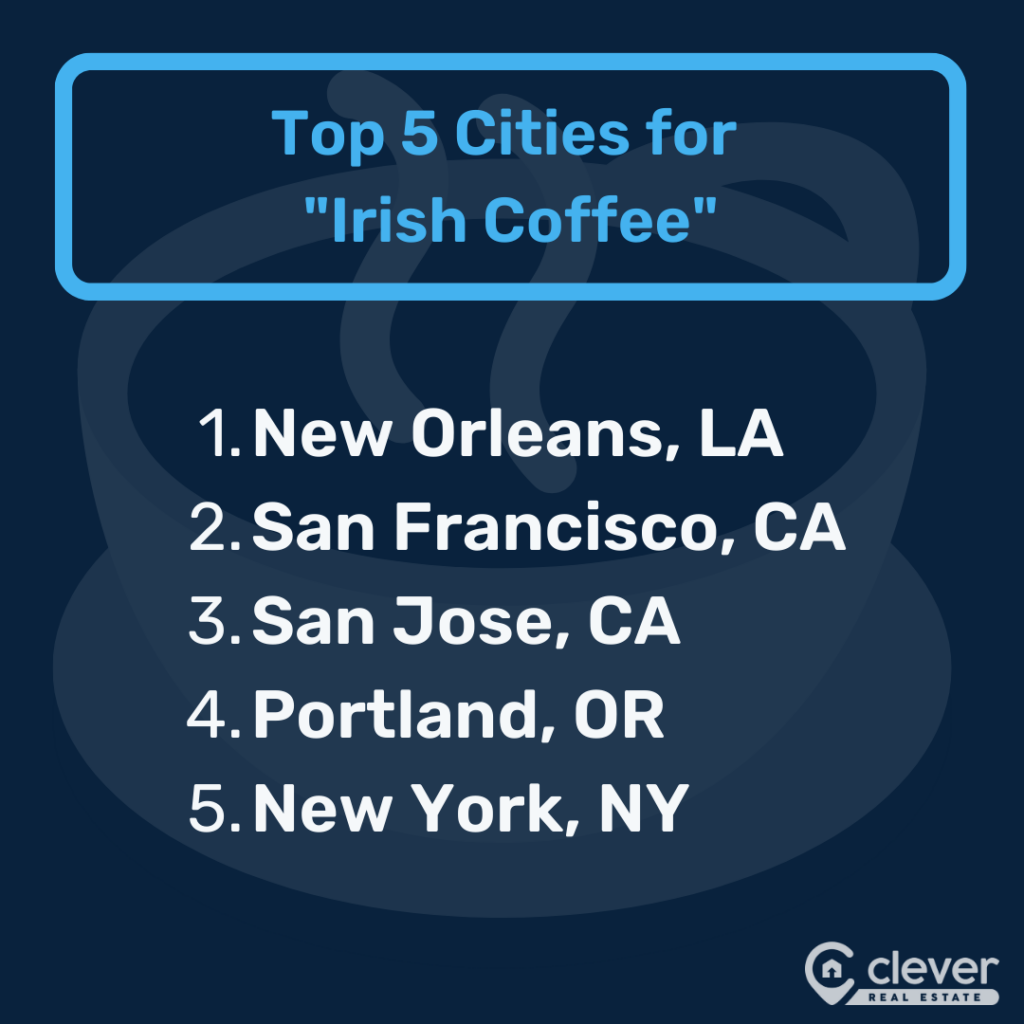
- Espresso is most popular in Seattle, while Irish coffee is most popular in New Orleans, according to Google Trends.👇
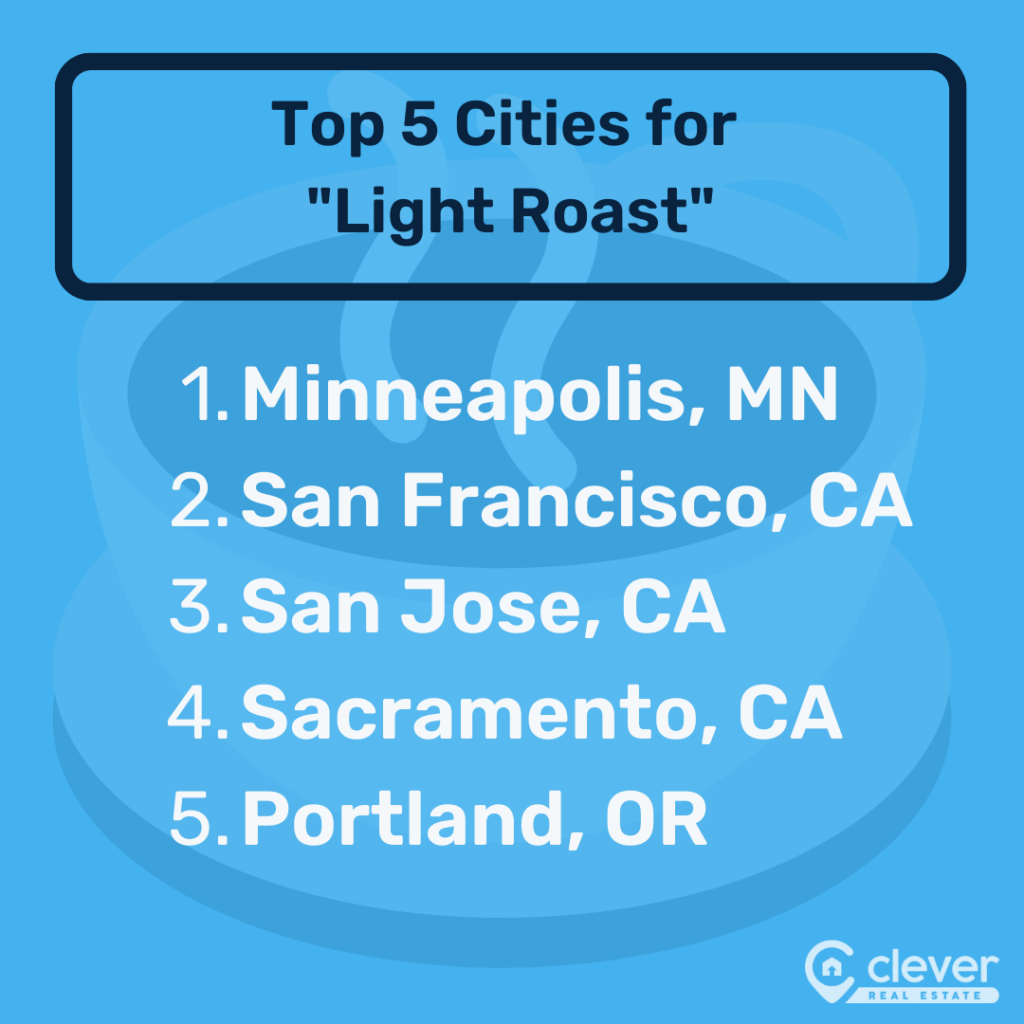
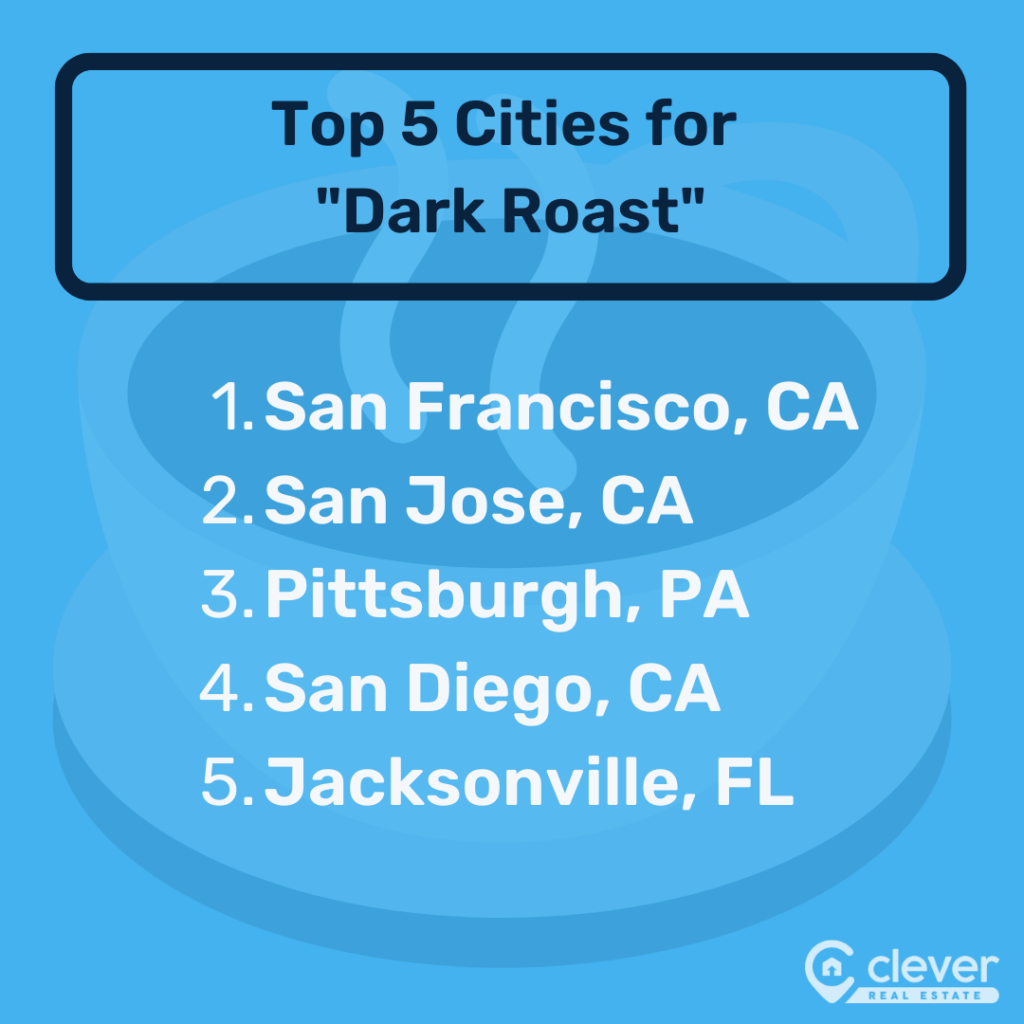
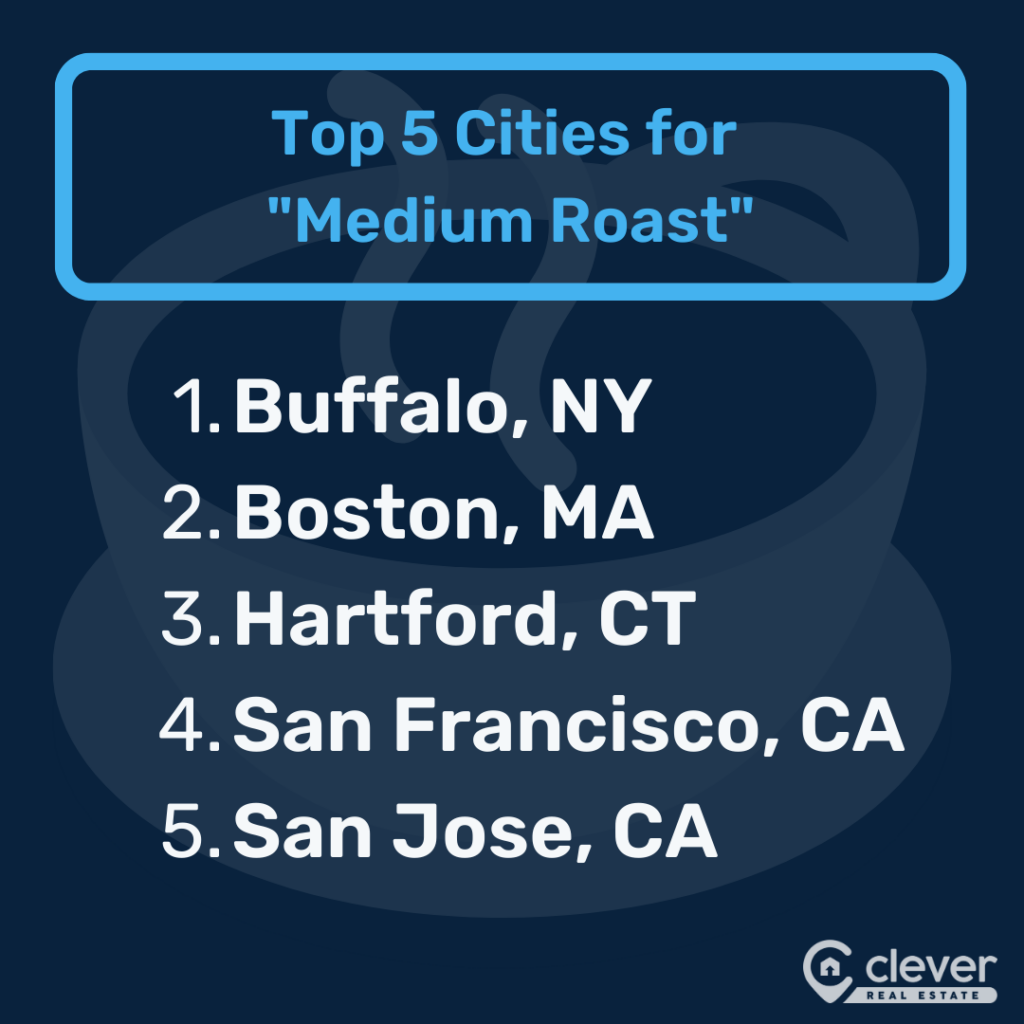
- Minneapolis has the most searches for light roast coffee, while Buffalo, New York, and San Francisco search the most for medium roast and dark roast, respectively.👇
The 50 Best Coffee Cities in the U.S., Ranked
| Rank | City | Average Price for a Cappuccino | Coffee Shops per 100,000 Residents | Average Yelp Score for Coffee Shops | Rank Change From 2022 | Coffee Roasteries per 100,000 Residents | Coffee Passion Score* | % of Annual Income** | Donut Shops per 100,000 Residents | |
| - | National Average | $5.16 | 12.6 | 4.33 | - | 0.7 | 78 | 1.65% | 2 | |
| 1 | Portland, OR | $5.42 | 27.8 | 4.36 | 21 | 2.4 | 91.9 | 1.60% | 2 | |
| 2 | San Jose, CA | $5.96 | 29.6 | 4.31 | 22 | 0.9 | 99.6 | 1.00% | 3.7 | |
| 3 | San Diego, CA | $5.46 | 20.8 | 4.32 | 18 | 1.5 | 95 | 1.40% | 1.9 | |
| 4 | Denver, CO | $5.33 | 20.5 | 4.45 | 15 | 1.4 | 88.2 | 1.40% | 1.5 | |
| 5 | San Francisco, CA | $5.56 | 17.4 | 4.32 | 8 | 1.1 | 99.6 | 1.10% | 1.7 | |
| 6 | Providence, RI | $4.39 | 17.3 | 4.25 | -2 | 0.7 | 76.4 | 1.40% | 8.1 | |
| 7 | Hartford, CT | $4.48 | 15 | 4.02 | -5 | 0.7 | 87.9 | 1.40% | 7.1 | |
| 8 | Boston, MA | $5.27 | 18.2 | 4.23 | -5 | 0.3 | 94.9 | 1.30% | 6 | |
| 9 | Las Vegas, NV | $5.57 | 25.9 | 4.48 | 36 | 0.6 | 74.2 | 2.10% | 3.1 | |
| 10 | Seattle, WA | $6.37 | 17.4 | 4.32 | 7 | 1.2 | 100 | 1.60% | 1.1 | |
| 11 | New Orleans, LA | $5.00 | 25.4 | 4.34 | 26 | 0.8 | 63.2 | 2.10% | 3.5 | |
| 12 | Salt Lake City, UT | $5.00 | 20.1 | 4.38 | 3 | 1.1 | 64.2 | 1.40% | 1.1 | |
| 13 | Austin, TX | $5.52 | 14.7 | 4.23 | 1 | 1.4 | 84.9 | 1.50% | 1.4 | |
| 14 | New York, NY | $5.47 | 16.8 | 4.24 | 13 | 0.6 | 90.8 | 1.60% | 2.7 | |
| 15 | Sacramento, CA | $5.45 | 12.4 | 4.36 | 1 | 1.2 | 89 | 1.60% | 1.9 | |
| 16 | Louisville, KY | $4.71 | 14.9 | 4.42 | 34 | 1.2 | 54.2 | 1.80% | 2.8 | |
| 17 | Buffalo, NY | $4.96 | 17.8 | 4.28 | 9 | 0.6 | 70.5 | 1.90% | 3 | |
| 18 | Milwaukee, WI | $4.46 | 13.3 | 4.45 | 7 | 0.6 | 82.7 | 1.60% | 1.5 | |
| 19 | Orlando, FL | $4.77 | 14.1 | 4.39 | 4 | 0.7 | 76.9 | 1.70% | 2.1 | |
| 20 | Pittsburgh, PA | $4.53 | 12 | 4.39 | -11 | 0.8 | 83.3 | 1.70% | 1.5 | |
| 21 | Philadelphia, PA | $4.76 | 10.5 | 4.45 | -13 | 0.6 | 80.5 | 1.50% | 2.8 | |
| 22 | Columbus, OH | $4.86 | 12.1 | 4.26 | 10 | 0.6 | 82.1 | 1.70% | 1.9 | |
| 23 | Nashville, TN | $5.45 | 11.5 | 4.35 | 16 | 0.9 | 78.5 | 1.80% | 1.3 | |
| 24 | Washington, DC | $5.52 | 12.7 | 4.25 | -17 | 0.4 | 80.7 | 1.20% | 1.3 | |
| 25 | Baltimore, MD | $4.75 | 10.7 | 4.22 | -24 | 0.5 | 79.6 | 1.40% | 2.2 | |
| 26 | Los Angeles, CA | $5.42 | 10.1 | 4.42 | -14 | 0.4 | 94 | 1.60% | 2 | |
| 27 | Raleigh, NC | $5.56 | 11 | 4.33 | 11 | 0.7 | 78.1 | 1.60% | 1.1 | |
| 28 | Minneapolis, MN | $5.98 | 11 | 4.39 | 7 | 0.7 | 88.6 | 1.70% | 0.8 | |
| 29 | Chicago, IL | $5.69 | 10.3 | 4.23 | -11 | 0.5 | 89.2 | 1.80% | 2.2 | |
| 30 | Richmond, VA | $4.78 | 13.4 | 4.31 | 13 | 0.6 | 56.7 | 1.50% | 1.4 | |
| 31 | Indianapolis, IN | $4.17 | 8.8 | 4.49 | 9 | 0.4 | 75.7 | 1.40% | 0.7 | |
| 32 | Cleveland, OH | $5.09 | 8.9 | 4.32 | -4 | 0.6 | 84.2 | 2.00% | 1.3 | |
| 33 | Cincinnati, OH | $4.61 | 10 | 4.44 | -27 | 0.4 | 71 | 1.60% | 1.3 | |
| 34 | Charlotte, NC | $4.98 | 9.4 | 4.41 | 7 | 0.5 | 75.1 | 1.70% | 1.4 | |
| 35 | Kansas City, MO | $5.34 | 8.1 | 4.55 | -2 | 0.8 | 73.7 | 1.80% | 0.8 | |
| 36 | Oklahoma City, OK | $5.53 | 11.1 | 4.52 | -26 | 0.7 | 58.1 | 2.20% | 2.5 | |
| 37 | Riverside, CA | $4.04 | 4.4 | 4.23 | -32 | 0.1 | 92.5 | 1.30% | 1.4 | |
| 38 | Tampa, FL | $4.90 | 8.1 | 4.4 | -7 | 0.5 | 78.9 | 1.80% | 1.1 | |
| 39 | Phoenix, AZ | $5.63 | 7.4 | 4.41 | 3 | 0.4 | 84 | 1.80% | 0.7 | |
| 40 | Jacksonville, FL | $5.08 | 7.8 | 4.39 | 9 | 0.5 | 63.3 | 1.70% | 1.4 | |
| 41 | St. Louis, MO | $4.37 | 5.4 | 4.46 | -11 | 0.3 | 74.4 | 1.50% | 0.7 | |
| 42 | Birmingham, AL | $5.17 | 9.8 | 4.34 | 6 | 0.7 | 50.1 | 2.00% | 1.2 | |
| 43 | Virginia Beach, VA | $5.38 | 6.1 | 3.92 | 3 | 0.7 | 65.7 | 1.90% | 0.8 | |
| 44 | Miami, FL | $4.83 | 6.6 | 4.18 | -10 | 0.3 | 69.6 | 1.80% | 0.5 | |
| 45 | Detroit, MI | $4.81 | 4.1 | 4.43 | -9 | 0.2 | 80.6 | 1.80% | 0.8 | |
| 46 | Dallas, TX | $5.39 | 4.6 | 4.33 | -35 | 0.2 | 78.5 | 1.70% | 0.9 | |
| 47 | San Antonio, TX | $5.83 | 9.1 | 4.44 | -3 | 0.3 | 64.5 | 2.20% | 0.9 | |
| 48 | Atlanta, GA | $5.64 | 5.2 | 4.4 | -28 | 0.3 | 73.3 | 1.70% | 0.8 | |
| 49 | Memphis, TN | $4.96 | 5.5 | 4.09 | -2 | 0.5 | 42.6 | 2.00% | 4.4 | |
| 50 | Houston, TX | $5.86 | 4.9 | 4.24 | -21 | 0.3 | 71.4 | 2.00% | 0.8 | |
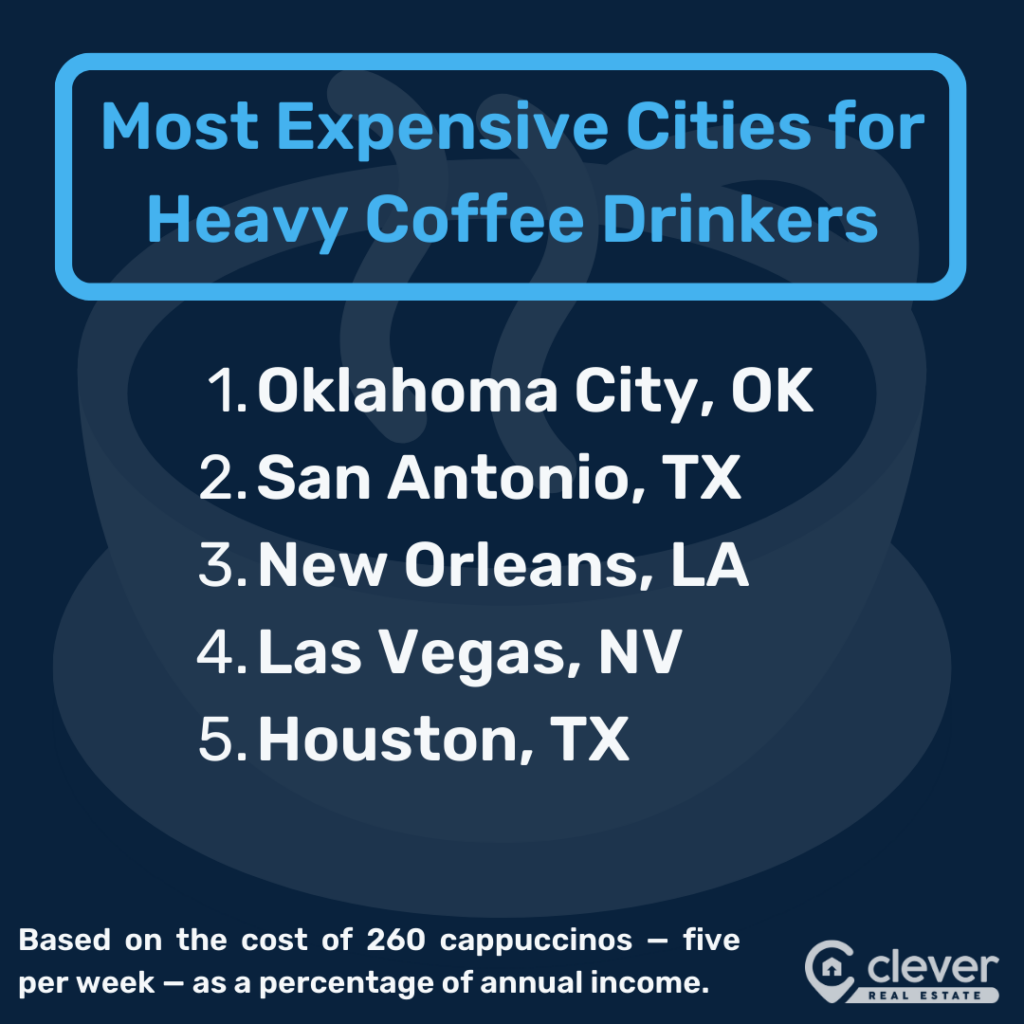
| *Interest scores are the average score of 16 coffee-related terms on Google Trends, on a scale of 0 to 100. **Based on the cost of one cappuccino per weekday as a percentage of annual income, rounded to the nearest tenth. | ||||||||||
The 15 Best Coffee Cities
California emerged as the ultimate coffee haven. The Golden State boasts an impressive trio, with San Jose, San Diego, and San Francisco taking prominent positions in our top five and Sacramento securing a place in the top 15.
Remarkably, not a single California city found itself in the bottom 10, proving that the love for good coffee extends across the entire state — even in Riverside, which was ranked as one of the worst coffee scenes by Americans last year.
California cities stand out with a staggering 58% more coffee shops per capita than average. Additionally, the state exhibits a heightened interest in coffee, scoring 87 out of 100 in Google Trends interest compared to the national average of 78.
The average price of a cappuccino in California is just $4.77. Find out how much your local coffee costs you!
1. Portland, OR
| 🫘 We’ll Roast to That Portland has 2.4 coffee roasteries per 100,000 residents — nearly 4x as many as the average American city (0.7). |
Portland stands out for its eclectic coffee culture, boasting a coffee passion score of 91.9, which surpasses the average city's score of 78. This places Portland 18% above the study's average in terms of coffee enthusiasm.
Enjoying a daily cappuccino throughout the week in Portland would take up only 1.58% of the median household income, a slightly lower percentage compared to the 1.65% in the average city.
Moreover, the city stands out with 27.8 coffee shops per 100,000 residents, a significant contrast to the study's average of 12.6 coffee shops per 100,000 residents. This signifies a 120% surplus of coffee shops in Portland. One of Portland’s most notable local coffee shops is Albina Press, considered one of the oldest staples in the city’s scene.
- Roasting preference: Light roast
- Starbucks or Dunkin': Starbucks
2. San Jose, CA
| 💰 Coffee Shopping San Jose has plenty of options for coffee lovers! It has the highest number of coffee shops in the study with 29.6 per 100,000 residents — 135% than the average city (12.6). |
In San Jose, a daily cappuccino throughout the workweek for a year accounts for only 1.04% of the median household income — 37% less than the average city’s percentage (1.65%).
Beyond coffee culture, San Jose distinguishes itself with a robust donut scene, boasting 3.7 donut shops per 100,000 residents, almost double the average city's count of 2 donut shops per 100,000 residents. This translates to an impressive 85% more donut shops per capita in San Jose than in the average city in our study.
- Roasting preference: Light roast
- Starbucks or Dunkin': Starbucks
» Read more stats on California
3. San Diego, CA
| 🧑💻 On the Grind San Diegans are very interested in coffee. They earned a 95 out of 100 coffee passion score based on their Google searches of coffee-related terms. That’s a 22% higher coffee passion score than the average city. |
In San Diego, a thriving coffee culture is evident with an impressive count of 20.8 coffee shops per 100,000 residents, 65% more than the average city in our study, which has just 12.6 coffee shops per 100,000 residents.
The city is home to a robust coffee roasting scene as well, featuring 1.5 coffee roasteries per 100,000 residents, in stark contrast to the average city's 0.7 coffee roasteries per 100,000 residents. That's 114% more.
- Roasting preference: Light roast
- Starbucks or Dunkin': Starbucks
4. Denver, CO
| ♨️ Warm and Roasty Denver is another hot spot for coffee roasteries! It’s home to 1.4 coffee roasteries per 100,000 residents – 105% more than the average city (0.7). |
Denver has a flourishing coffee scene with 20.5 coffee shops per 100,000 residents — 63% more than the average city’s number of coffee shops per capita (12.6). One of the many local favorites is Dazbog Coffee, which has several locations around the city.
Not only is the quantity of coffee shops in Denver impressive, but the quality also stands out. Denver has one of the highest-rated coffee shop scenes in the nation. It earned an overall 4.45 stars out of 5 on Yelp. The average city earns just 4.33 stars.
- Roasting preference: Light roast
- Starbucks or Dunkin': Starbucks
5. San Francisco, CA
| ⚖️ A Brew-tiful Balance A cappuccino each weekday for a year would consume 1.13% of the median household income in San Francisco, 32% less than the average city (1.65%). |
San Fran isn’t just the most LGBTQ-friendly city in the nation, it’s one of the best for coffee, too. It’s home to 17.4 coffee shops per 100,000 residents, surpassing the average city in our study, which tallies just 12.6 coffee shops per 100,000 residents. This equates to 38% more coffee shops per capita in San Francisco than the average American city.
Beyond the sheer quantity, the city distinguishes itself by also having a significant number of coffee roasteries. Featuring 1.1 coffee roasteries per 100,000 residents — compared to the average city's count of 0.7 — San Francisco has 63% more than average.
- Roasting preference: Light roast
- Starbucks or Dunkin': Starbucks
6. Providence, RI
| 🍩 Donut Worry About It With 8.07 donut shops per 100,000 residents, the most in the study, Providence has 304% more donut shops per capita than the average city, which has just 2 per 100,000 residents. |
Providence stands out as the highest-ranking city with a preference for Dunkin’ over Starbucks. In Providence, indulging in a cappuccino comes at an average cost of $4.39, presenting a more budget-friendly option than the $5.16 coffee drinkers would pay in the average city in our study. Providence coffee is a noteworthy 15% lower than the average cost nationwide.
Not only is Providence more affordable than other cities, but it also has a flourishing coffee scene with 17.3 coffee shops per 100,000 residents, surpassing the average city in our study, which has just 12.6. That’s an impressive 37% more coffee shops per capita than the average city in our study.
- Roasting preference: Medium roast
- Starbucks or Dunkin': Dunkin'
» Read more stats on Rhode Island
7. Hartford, CT
| 🧑🍳 Baking It Hartford’s love for donuts can’t be glazed over. At 7.1 donut shops per 100,000 residents, Hartford has 255% more donut shops per 100,000 residents than the average city in our study (2). |
For Hartford residents, enjoying a daily cappuccino throughout the workweek proves to be a financially lighter indulgence. It consumes just 1.36% of the median household income, in contrast to the 1.65% in the average city we studied. That’s 18% in annual savings.
Beyond the realm of cappuccinos, Hartford stands out with 15 coffee shops per 100,000 residents. That's 19% more than the average city in our study, which counts 12.6 coffee shops per 100,000 residents.
- Roasting preference: Medium roast
- Starbucks or Dunkin': Dunkin'
» Read more stats on Connecticut
8. Boston, MA
| ☕ Searching for Coffee Of course Beantown is passionate about coffee! With a coffee passion score of 94.9 out of 100, Boston residents search for coffee-related terms 22% more than the average city (78). |
Boston has 18.2 coffee shops per 100,000 residents, compared to the average city in our study, which has 12.6 per 100,000 residents. This means that Boston has 45% more coffee shops per capita than the average city.
Boston also has a plethora of donut shops from which to choose. It’s home to 6 donut shops per 100,000 residents, a remarkable three times more than the average city in our study, which has 2 donut shops per 100,000 residents.
- Roasting preference: Light roast
- Starbucks or Dunkin': Dunkin'
» Read more stats on Massachusetts
9. Las Vegas, NV
| 💯 Check out the Scoreboard Vegas never disappoints. Las Vegas has an average coffee shop rating of 4.48 stars out of 5 — one of the highest in the study. The average city in our study has an average coffee shop rating of just 4.33 stars. |
In Las Vegas, the coffee culture thrives with an impressive density of 25.9 coffee shops per 100,000 residents — a stark contrast to the average city in our study, which boasts 12.6 coffee shops per 100,000 residents. That's a 106% difference.
Beyond coffee, the city also caters to sweeter cravings, with 3.1 donut shops per 100,000 residents, exceeding the average city in our study (2) by 55%.
- Roasting preference: Dark roast
- Starbucks or Dunkin': Starbucks
10. Seattle, WA
| 😇 Coffee Shop Heaven Unsurprisingly, Starbucks’ hometown has a lot of coffee shops in general. It’s home to 17.4 coffee shops per 100,0000 residents — 38% more than the average city (12.6). |
Seattle stands out as a coffee enthusiast's haven with a perfect coffee passion score of 100, surpassing the average city in the study by 28%. Not only does Seattle have a passionate coffee scene, it also offers financial perks, with a cappuccino each weekday for a year consuming only 1.55% of the median household income — 6% less than in the average city.
The city further distinguishes itself with a notable 1.2 coffee roasteries per 100,000 residents, showcasing a substantial 77% more coffee roasteries than the average city in the study.
- Roasting preference: Light roast
- Starbucks or Dunkin': Starbucks
» Read more stats on Washington
11. New Orleans, LA
| 💃 Move Over, Beignets Needless to say, NOLA donut shops are also selling the city’s beloved flakey and sugary pastry, the beignet. It’s not often that its donuts shine, as well, but New Orleans is home to 3.5 donut shops per 100,000 residents. That's 75% more than the average city (2). |
New Orleans is renowned for its distinctive chicory coffee, a unique and hickory-flavored twist that adds to the city's rich culinary offerings. Visitors from around the world can pick up a canister of chicory coffee at Café du Monde, one of NOLA’s most popular coffee shops and tourist destinations.
New Orleans enjoys a whopping 25.4 coffee shops per 100,000 residents. That's 102% more coffee shops per capita than the average city in our study, which has just 12.6 coffee shops per 100,000 residents.
- Roasting preference: Dark roast
- Starbucks or Dunkin': Starbucks
» Read more stats on Louisiana
12. Salt Lake City, UT
| 🥤 Cheap Sips In Salt Lake City, a weekday cappuccino for a year costs 14% less of the median household income than in the average city. In SLC, heavy coffee drinkers spend just 1.41% of their income on coffee, compared to 1.65% nationally. |
Salt Lake City stands out in our study with 20.1 coffee shops per 100,000 residents, a notable 59% more than the average city's 12.6 coffee shops per 100,000 residents.
Additionally, Salt Lake City embraces the art of coffee roasting with 1.1 coffee roasteries per 100,000 residents, surpassing the studied city average of 0.7 coffee roasteries per 100,000 residents. That’s 61% more coffee roasteries than average.
- Roasting preference: Light roast
- Starbucks or Dunkin': Starbucks
13. Austin, TX
| ❤️ Deep in the Heart It’s no secret that Austin is home to one of Texas’ most vibrant coffee scenes. As such, Austinites are more passionate about coffee than other cities. Austin earned a coffee passion score 84.9 out of 100 – 9% higher than average (78). |
Texas’ capital offers a warm respite for coffee enthusiasts. Austin is home to 14.7 coffee shops per 100,000 residents — 16% more than the average city (12.6).
Austin's commitment to the craft extends to coffee roasteries, with 1.4 establishments per 100,000 residents, eclipsing the studied city average of 0.7 coffee roasteries per 100,000 residents. That’s a 99% difference.
- Roasting preference: Light roast
- Starbucks or Dunkin': Starbucks
14. New York, NY
| 🥯 Bagels, Schmagels With its reputation for bagels outshining other baked goods, NYC is, in fact, home to some of the best donut shops on earth — and it has lots of ‘em. New York City has 2.7 donut shops per 100,000 residents, 35% more than average (2). |
New York City, known for its bustling lifestyle, exhibits a distinctive coffee culture that is respected around the world. As such, it has some of the most fervent Google searches for coffee-related terms. With a coffee passion score of 90.8, NYC stands out with a notable 16% higher passion score than the average city (78).
Additionally, the city boasts 16.8 coffee shops per 100,000 residents, surpassing the national average of 12.6 coffee shops per 100,000 residents. This signifies a remarkable 34% more coffee shops per capita in NYC.
- Roasting preference: Light roast
- Starbucks or Dunkin': Dunkin'
15. Sacramento, CA
| ☀️ West Roast Sacramento rounds out the top 15, cementing California’s status as one of the best states for coffee. With 1.2 coffee roasteries per 100,000 residents, Sacramento has 75% more coffee roasteries per capita than the average city (0.7). |
Sacramento emerged as a city with a robust coffee culture, with a coffee passion score of 89 out of 100, surpassing the average city's score of 78 by 14%. Beyond its enthusiasm for coffee, Sacramento demonstrates affordability. Consuming a cappuccino each weekday for a year accounts for only 1.59% of the median household income.
Nationally, the same coffee habit would consume a slightly higher 1.65% of the median household income. Despite being in one of the most expensive states, Sacramento residents enjoy a 4% savings on their coffee habit compared to the average city.
- Roasting preference: Light roast
- Starbucks or Dunkin': Starbucks
Data Details: Top 5 Coffee Cities by Category
The 10 Worst Coffee Cities
Not all cities foster a vibrant coffee culture, and 10 places emerged as notably less welcoming to cafe-goers:
- Houston, Texas
- Memphis, Tennessee
- Atlanta, Georgia
- San Antonio, Texas
- Dallas, Texas
- Detroit, Michigan
- Miami, Florida
- Virginia Beach, Virginia
- Birmingham, Alabama
- St. Louis, Missouri
Cities in the bottom 10 have 51% fewer coffee shops than average (6.13) and 42% fewer roasteries than average (0.4). That's not very thrilling for diehard coffee fans.
Our worst coffee city, Houston, plummeted to the bottom, falling far from its No. 29 ranking in 2022. The reasons behind this drop are evident. Houston is home to just 4.9 coffee shops per 100,000 residents — a stark contrast to the average city's 12.6. This represents a 61% shortfall in coffee shops compared to the average city.
Similarly, in terms of coffee roasteries, Houston records just 0.3 per 100,000 residents — 58% fewer than the average city (0.7). Despite the love Texans have for donuts, Houston also falls short. There are only 0.8 donut shops per 100,000 residents, compared to 2 in the average city — a 58% difference.
Methodology
Clever Real Estate compared the 50 most populous U.S. metro areas across several metrics. Each metric was normalized and graded on a 100-point scale. The combined weighted average of each score determined the overall "coffee city" score upon which the final ranking was based.
The metrics used are as follows:
- Number of coffee shops per 100,000 residents (27.3%)
- Number of coffee roasteries per 100,000 residents (18.2%)
- Google Trends popularity for 16 different coffee terms, each equally weighted: coffee, cappuccino, coffee shop, whole bean, latte, espresso, Starbucks, Irish coffee, Arabica, French press, dark roast, medium roast, light roast, macchiato, mocha, and Dunkin' (18.2%)
- Percentage of local annual income spent on buying a cup of coffee every weekday (9.1%)
- Average price of a cappuccino (9.1%)
- Number of donut shops per 100,000 residents (9.1%)
- Average Yelp rating of a random sampling of coffee shops (9.1%)
Sources: U.S. Census American Community Survey, U.S. Bureau for Economic Analysis, Google Trends, Yelp, and Numbeo.
About Clever Real Estate
Since 2017, Clever Real Estate has been on a mission to make selling or buying a home easier and more affordable for everyone. About 12 million annual readers rely on Clever's library of educational content and data-driven research to make smarter real estate decisions, and to date, Clever has helped consumers save more than $160 million on Realtor fees. Clever's research has been featured in The New York Times, Business Insider, Inman, Housing Wire, and many more.
More Research from Clever
American Home Buyer and Seller Report (2023 Edition): To learn how buyers and sellers are navigating this bizarre new market, we surveyed 1,000 Americans who purchased a home in 2022 and 2023.
The Best and Worst Cities for Commuters in 2023: We ranked the most commuter-friendly cities as well as the best cities for public transit in the U.S. in this comprehensive study.
2023 Data: The Most and Least LGBTQ-Friendly Cities in the U.S.: A ranking of America's 50 most-populous cities highlights the best and worst places for LGBTQ Americans to live and visit.
Articles You Might Like
11 Best Companies That Buy Houses for Cash: Looking to sell your home fast? We found the best companies that buy houses for cash.
The Best Low Commission Realtors and Brokers (2023 Update): Find out who the best low-commission real estate brokers are in 2023, including Clever, Redfin, and more.
Best 1 Percent Commission Realtors Across the U.S.: This guide breaks down the top brands offering a 1% realtor commission (or close to it).
Frequently Asked Questions
What city has the best coffee in America?
Although Portland is the best city overall for coffee lovers, Kansas City, Missouri, has the highest-rated coffee shops with an average Yelp score of 4.55. Find out more.
What U.S. state has the best coffee?
We’ve designated California as our best coffee state because three of the top five coffee cities are located in the Golden State. Find out more about our top coffee cities.
Where is the coffee capital of the U.S.?
Portland is the coffee capital of the U.S. It has 27.8 coffee shops per 100,000 residents — 120% more than the average city (12.6). Find out more.