
🏘 What cities have the best and worst rent-to-income ratio for minimum-wage workers? 🏘
Those working a full-time minimum wage job in Buffalo, New York, pay 39% of their monthly income for a typical one-bedroom rental. Meanwhile, they’d need 132% of their pay to rent a one-bedroom unit in Atlanta.
Buffalo Cheapest, but Not Affordable | Regional Minimum Wage Differences | Housing Challenges for Federal Minimum-Wage Earners | Minimum Wage vs. Required Earnings for Affordable Rentals | Methodology | FAQs
Since it first came onto the federal books in 1938, the minimum wage has helped low-income workers everywhere by setting a floor on how much employers can pay for their labor. Although it’s risen significantly over the past eight decades, so has the price of everything else — perhaps most notably, the cost of buying or renting a home.
The federal minimum wage sits at $7.25 per hour, where it’s been since July 2009. Although 30 states have passed higher minimums of their own and a strong labor market in recent years has pushed wages up for many lower-paid workers, 1.1% of American workers still made just that federal minimum in 2023.
That means hundreds of thousands or even millions of Americans have to figure out how to pay rent, and their other expenses, on a full-time weekly salary of only $290, pre-tax. That’s barely $15,000 annually.
To find out how realistic it is for minimum-wage workers to rent a typical unit in their city, Clever evaluated the 50 largest housing markets in the United States, looking at typical rent prices for units of various sizes and how they relate to the area’s minimum wage.
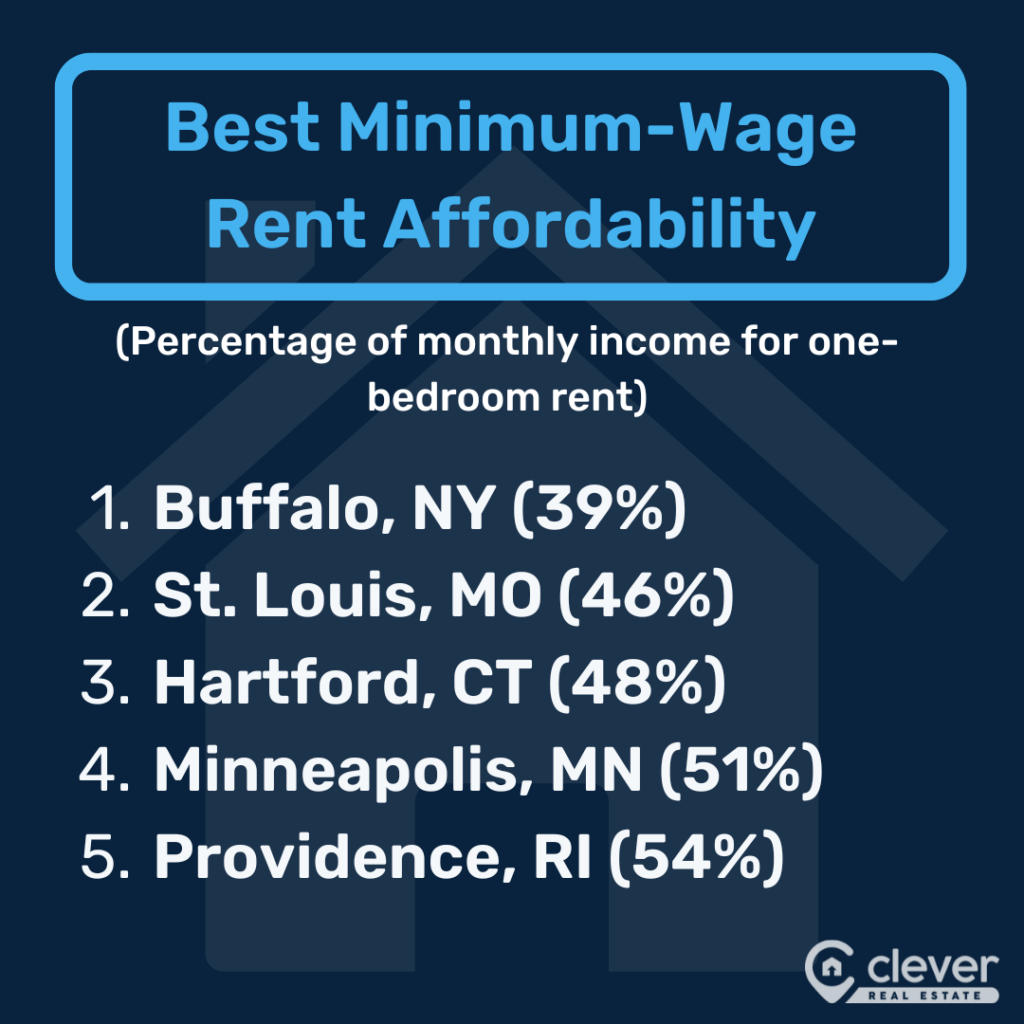
The combination of moderate rent and a relatively high minimum wage makes Buffalo, New York, the nation’s most affordable city for minimum-wage earners, requiring 39% of their income for a typical one-bedroom unit. It’s one of just three cities where this number is under 50%, along with St. Louis (46%) and Hartford, Connecticut (49%).
However, the data revealed none of the country’s 50 largest cities is home to one-bedroom rentals that meet the common affordability threshold of 30% of local minimum wage incomes.
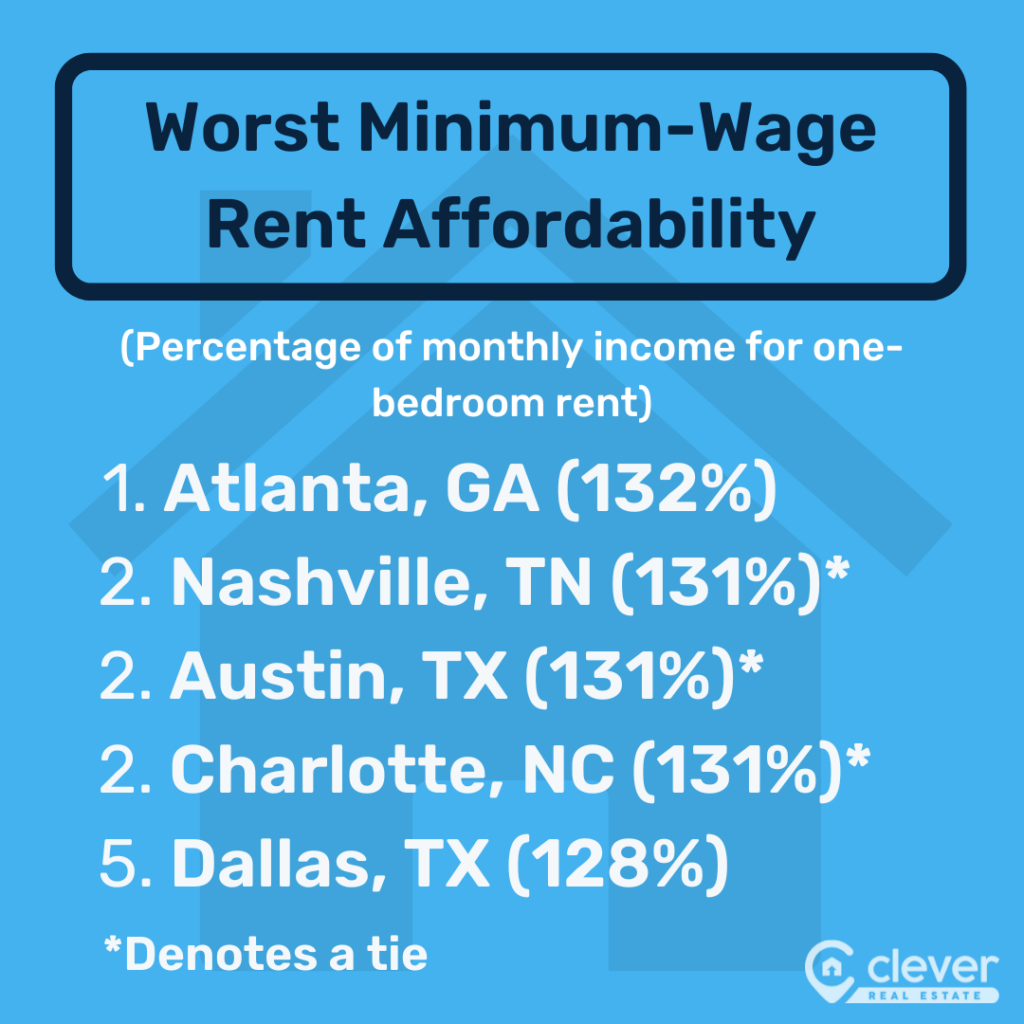
Low-paid Atlanta workers face the most significant challenges, with relatively pricey one-bedroom units that cost 132% of their federal minimum-wage incomes.
We also explored what affordable rent levels would be for minimum-wage workers in various markets, as well as what the minimum wage would need to be in each area to achieve true affordability.
Read on to learn more about where those earning the minimum wage have the easiest and toughest time getting by.
💰 Rent-to-Income Ratio Statistics 💰
- Rent on a typical one-bedroom unit in Buffalo, New York, takes up the smallest percentage (39%) of a local full-time minimum-wage worker’s income.
- None of the 50 largest metro areas offers one-bedroom rentals that are affordable for minimum-wage workers looking to spend 30% or less of their income.
- A pair of full-time workers earning minimum wage would only find one-bedroom units affordable on their combined income in nine cities.
- Fifteen cities require three or more full-time minimum-wage incomes for an affordable one-bedroom rental.
- Atlanta is home to the worst housing cost burden for minimum-wage earners, with a typical one-bedroom unit renting for 132% of their monthly income.
- In seven cities, even studio apartment rentals exceed the monthly local minimum wage earnings.
- Only Buffalo and St. Louis provide two-bedroom rentals that are affordable on two minimum-wage incomes.
- Regionally, eight of the 15 cities with the lowest rent burden for local minimum-wage workers are located in the Midwest. Three — including No. 1 Buffalo — are in the Northeast, with three more in the West. Only one is located in the South.
- The top 24 cities, when ranked by one-bedroom affordability, all have a minimum wage higher than the federal minimum.
- The bottom 11 are all sitting at the federal minimum wage of $7.25.
- To keep the same purchasing power in the face of 15 years of inflation, the federal minimum wage would need to be raised to $10.59 per hour. Just over half of markets pay a minimum wage above that level.
- Even if every metro in the country increased the minimum wage by $10 per hour, a single minimum-wage worker could only affordably rent a one-bedroom apartment in five of the 50 largest cities.
- Nineteen cities have a minimum wage of at least $20 less than what would be required for a single person to affordably rent a one-bedroom apartment.
- With a monthly income of roughly $1,257 before taxes, an “affordable” rent payment for federal minimum-wage earners would be just $377 for a single renter or $754 for a couple or roommates.
| Rank | City | Minimum Wage | Typical 1BR Fair Market Rent | % of Minimum Wage Income to Rent 1BR | Necessary Minimum Wage to Afford 1BR Rent* | Actual Affordable Rent for Minimum-Wage Workers* | Minimum Wage Incomes to Afford 1BR Rent* |
| 1 | Buffalo, NY | $15.00 | $1,001 | 39% | $19.25 | $780 | 1.28 |
| 2 | St. Louis, MO | $12.30 | $984 | 46% | $18.92 | $640 | 1.54 |
| 3 | Hartford, CT | $15.69 | $1,306 | 48% | $25.12 | $816 | 1.60 |
| 4 | Minneapolis, MN | $15.57 | $1,381 | 51% | $26.56 | $810 | 1.71 |
| 5 | Providence, RI | $14.00 | $1,319 | 54% | $25.37 | $728 | 1.81 |
| 6 (tie) | Cincinnati, OH | $10.45 | $993 | 55% | $19.10 | $543 | 1.83 |
| 6 (tie) | Cleveland, OH | $10.45 | $995 | 55% | $19.13 | $543 | 1.83 |
| 6 (tie) | Kansas City, MO | $12.30 | $1,183 | 55% | $22.75 | $640 | 1.85 |
| 9 | Denver, CO | $18.29 | $1,789 | 56% | $34.40 | $951 | 1.88 |
| 10 | Detroit, MI | $10.33 | $1,090 | 61% | $20.96 | $537 | 2.03 |
| 11 | Baltimore, MD | $15.00 | $1,604 | 62% | $30.85 | $780 | 2.06 |
| 12 | Portland, OR | $15.95 | $1,750 | 63% | $33.65 | $829 | 2.11 |
| 13 (tie) | Sacramento, CA | $16.00 | $1,777 | 64% | $34.17 | $832 | 2.14 |
| 13 (tie) | Chicago, IL | $14.00 | $1,560 | 64% | $30.00 | $728 | 2.14 |
| 15 (tie) | Columbus, OH | $10.45 | $1,194 | 66% | $22.96 | $543 | 2.20 |
| 15 (tie) | Seattle, WA | $19.97 | $2,293 | 66% | $44.10 | $1,038 | 2.21 |
| 17 | Riverside, CA | $16.00 | $1,852 | 67% | $35.62 | $832 | 2.23 |
| 18 (tie) | Phoenix, AZ | $14.35 | $1,679 | 68% | $32.29 | $746 | 2.25 |
| 18 (tie) | Washington, DC | $17.50 | $2,056 | 68% | $39.54 | $910 | 2.26 |
| 20 (tie) | Los Angeles, CA | $17.27 | $2,081 | 70% | $40.02 | $898 | 2.32 |
| 20 (tie) | Jacksonville, FL | $12.00 | $1,454 | 70% | $27.96 | $624 | 2.33 |
| 22 (tie) | Las Vegas, NV | $12.00 | $1,476 | 71% | $28.38 | $624 | 2.37 |
| 22 (tie) | Virginia Beach, VA | $12.00 | $1,483 | 71% | $28.52 | $624 | 2.38 |
| 24 | Richmond, VA | $12.00 | $1,545 | 74% | $29.71 | $624 | 2.48 |
| 25 | Oklahoma City, OK | $7.25 | $961 | 76% | $18.48 | $377 | 2.55 |
| 26 | San Francisco, CA | $20.96 | $2,780 | 77% | $53.46 | $1,090 | 2.55 |
| 27 | San Diego, CA | $16.85 | $2,328 | 80% | $44.77 | $876 | 2.66 |
| 28 | Tampa, FL | $12.00 | $1,686 | 81% | $32.42 | $624 | 2.70 |
| 29 | Orlando, FL | $12.00 | $1,727 | 83% | $33.21 | $624 | 2.77 |
| 30 (tie) | New York, NY | $16.00 | $2,330 | 84% | $44.81 | $832 | 2.80 |
| 30 (tie) | Milwaukee, WI | $7.25 | $1,056 | 84% | $20.31 | $377 | 2.80 |
| 32 | Pittsburgh, PA | $7.25 | $1,068 | 85% | $20.54 | $377 | 2.83 |
| 33 (tie) | Louisville, KY | $7.25 | $1,094 | 87% | $21.04 | $377 | 2.90 |
| 33 (tie) | Indianapolis, IN | $7.25 | $1,097 | 87% | $21.10 | $377 | 2.91 |
| 35 | Boston, MA | $15.00 | $2,288 | 88% | $44.00 | $780 | 2.93 |
| 36 (tie) | Birmingham, AL | $7.25 | $1,144 | 91% | $22.00 | $377 | 3.03 |
| 36 (tie) | Miami, FL | $12.00 | $1,898 | 91% | $36.50 | $624 | 3.04 |
| 38 | Memphis, TN | $7.25 | $1,207 | 96% | $23.21 | $377 | 3.20 |
| 39 (tie) | San Jose, CA | $17.55 | $2,975 | 98% | $57.21 | $913 | 3.26 |
| 39 (tie) | San Antonio, TX | $7.25 | $1,231 | 98% | $23.67 | $377 | 3.27 |
| 39 (tie) | New Orleans, LA | $7.25 | $1,236 | 98% | $23.77 | $377 | 3.28 |
| 42 | Houston, TX | $7.25 | $1,279 | 102% | $24.60 | $377 | 3.39 |
| 43 | Salt Lake City, UT | $7.25 | $1,453 | 116% | $27.94 | $377 | 3.85 |
| 44 | Philadelphia, PA | $7.25 | $1,512 | 120% | $29.08 | $377 | 4.01 |
| 45 | Raleigh, NC | $7.25 | $1,592 | 127% | $30.62 | $377 | 4.22 |
| 46 | Dallas, TX | $7.25 | $1,606 | 128% | $30.88 | $377 | 4.26 |
| 47 (tie) | Charlotte, NC | $7.25 | $1,647 | 131% | $31.67 | $377 | 4.37 |
| 47 (tie) | Austin, TX | $7.25 | $1,650 | 131% | $31.73 | $377 | 4.38 |
| 47 (tie) | Nashville, TN | $7.25 | $1,650 | 131% | $31.73 | $377 | 4.38 |
| 50 | Atlanta, GA | $7.25 | $1,653 | 132% | $31.79 | $377 | 4.38 |
What Is Affordable Rent?
Although every market is different, a general rule of thumb among financial experts is that no more than 30% of a person’s gross income should be spent on housing. For renters, this also includes utilities, renter’s insurance, and any other recurring housing-related expenses.
Some argue that benchmark is out of date and doesn’t take into account the specifics of a renter’s financial situation, especially for particularly high or low earners.
Still, this rent-to-income ratio is one of the best ways to get a true apples-to-apples comparison between employment and housing markets where earnings and rent prices can vary substantially.
For our analysis, we assumed minimum-wage employees worked a standard 40-hour workweek with no overtime or unpaid time off.
Bargains in Buffalo, But No Cities Offer Truly Affordable Rentals
Among the 50 largest U.S. metros, the most affordable rent on a minimum-wage income is found in Buffalo.
The metro enjoys a unique combination of lower-cost housing and a relatively strong state minimum wage of $15, more than double the federal minimum.
The fair market rent on a one-bedroom apartment ($1,001) eats up just 39% of a full-time minimum-wage income ($2,600 per month).
However, it’s crucial to note this ratio is still significantly higher than the 30% affordability standard, meaning none of the 50 largest cities in the United States offer truly affordable rentals to a single minimum-wage worker — even those willing to downsize to a studio.
Only three cities offer one-bedroom rentals that require less than half of the area’s minimum wage income: Buffalo (39%), St. Louis (46%), and Hartford, Connecticut (48%).
In every metro in our study, a single person would need to earn at least $18 per hour to afford rent on a one-bedroom apartment, using the 30% rule.
However, only three cities have minimum wages that high, although just No. 9 Denver ($18.29) ranks in the 10 most affordable cities for minimum wage workers. The others are No. 15 Seattle ($19.97) and No. 26 San Francisco ($20.96).
It’s not much better for couples or roommates, either. A pair of full-time workers, each earning minimum wage, could only affordably rent a one-bedroom apartment in nine of the 50 largest U.S. metros:
- Buffalo, New York
- St. Louis, Missouri
- Hartford, Connecticut
- Minneapolis, Minnesota
- Providence, Rhode Island
- Cincinnati, Ohio
- Cleveland, Ohio
- Kansas City, Missouri
- Denver, Colorado
Affordable living gets particularly crowded in 15 cities, where three or more full-time minimum-wage incomes are needed to meet the 30% affordability standard for a one-bedroom apartment:
- Atlanta, Georgia (4.38 minimum-wage incomes needed to rent a one-bedroom apartment)
- Nashville, Tennessee (4.38)
- Austin, Texas (4.38)
- Charlotte, North Carolina (4.37)
- Dallas, Texas (4.26)
- Raleigh, North Carolina (4.22)
- Philadelphia, Pennsylvania (4.01)
- Salt Lake City, Utah (3.85)
- Houston, Texas (3.39)
- New Orleans, Louisiana (3.28)
- San Antonio, Texas (3.27)
- San Jose, California (3.26)
- Memphis, Tennessee (3.2)
- Miami, Florida (3.04)
- Birmingham, Alabama (3.03)
Rent Outpaces Monthly Minimum-Wage Earnings in Many Cities
Conditions are especially dire for minimum-wage workers in nine cities where rent on a typical one-bedroom unit costs more than their entire monthly income. These cities are:
- Atlanta (132% of full-time minimum-wage income)
- Nashville, Tennessee (131%)
- Austin, Texas (131%)
- Charlotte, North Carolina (131%)
- Dallas (128%)
- Raleigh, North Carolina (127%)
- Philadelphia (120%)
- Salt Lake City (116%)
- Houston (102%)
With the exception of Philadelphia, all of these cities share one thing: strong population growth over the 2010s and into the early part of the 2020s.
In seven of those nine cities, minimum-wage workers would pay more than 100% of their income for a studio, with Salt Lake City and Houston the only exceptions.
Minimum-Wage Families Face the Biggest Challenges
It’s tough enough for a single person or couple to support themselves on minimum-wage salaries, but families that need more space can face seemingly insurmountable burdens if they’re only earning minimum wage.
Only Buffalo and St. Louis provide two-bedroom rentals that are affordable on two minimum-wage incomes.
Buffalo is the only city where a pair of minimum-wage workers could afford a three-bedroom unit. Four-bedroom rentals are unaffordable for a couple in all 50 cities studied.
Even with two parents and three working-age kids chipping in their minimum-wage earnings, it's not enough in 17 cities, where four-bedroom units require more than five minimum-wage incomes to affordably rent.
Stark Regional Differences Exist in Minimum Wage Affordability
For true affordability, workers need both a high local minimum wage and low-cost housing, a relatively rare combination.
Overall, the West has eight of the 10 highest minimum-wage cities, including six in California alone. Just one of the top 10 highest-paying cities is in the South (Washington, D.C.), and one is in the Northeast (New York City).
However, among cities that require the smallest percentage of a minimum-wage worker’s income to rent a one-bedroom apartment, eight of the 15 are located in the Midwest.
The Northeast has three, including No. 1 Buffalo, as does the West. Meanwhile, the South is home to 12 of the 15 worst cities when measured by the same metric. Only two are located in the West, and one is in the Northeast — No. 44 Philadelphia.
Philadelphia is notable in that it’s one of just two cities in the Northeast — alongside Pittsburgh — that still pays the federal minimum wage. Among the 18 cities that pay this rate, 13 are Southern. The Midwest has just two, while only one, Salt Lake City, is located in the West.
Bleak Prospects for Federal Minimum Wage Earners
Although many might think of minimum-wage workers as a single group, in reality, there can be a dramatic difference between what one of them makes in one state or city compared to another.
The top 24 cities, when ranked by one-bedroom affordability, all have a minimum wage higher than the federal minimum, whereas the bottom 11 all pay the federal minimum wage.
The federal minimum wage is particularly problematic because, unlike some states, it doesn’t adjust as the cost of living increases. In the face of 15 years of inflation, the federal minimum wage would need to be raised to $10.59 per hour to simply keep the same purchasing power as it had in 2009. Barely half of markets — just 28 out of 50 — pay a minimum wage above that level.
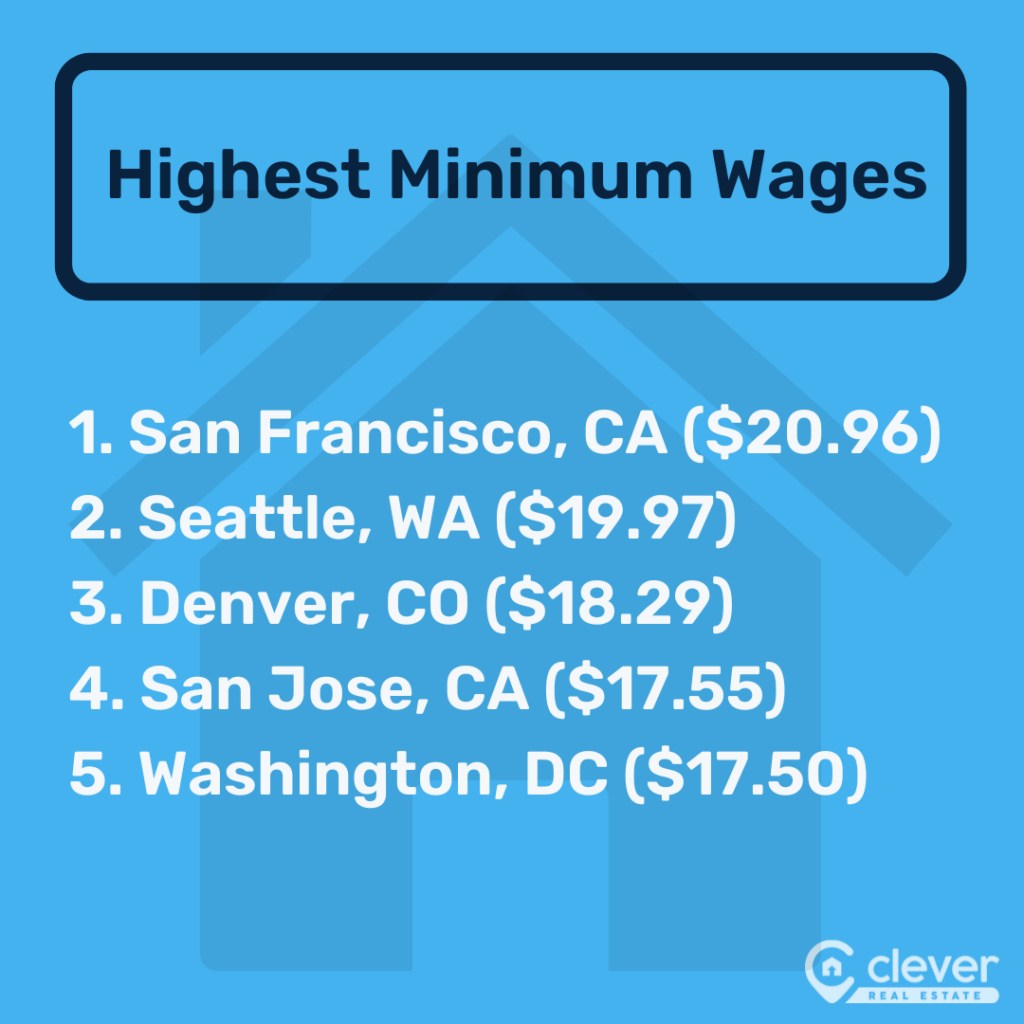
The highest minimum wage among cities in our study is in San Francisco, where the minimum wage is $20.96. The next highest is in Seattle at $19.97.
Unfortunately, this still may not be high enough for the notably pricy housing in both cities. Seattle ties for No. 15 for overall one-bedroom affordability, while San Francisco falls into the bottom half at No. 26.
| City | Minimum Wage | One-Bedroom Affordability (% of Full-Time Income, Rank) |
| San Francisco, CA | $20.96 | 77%, No. 26 |
| Seattle, WA | $19.97 | 66%, No. 15 (tie) |
| Denver, CO | $18.29 | 56%, No. 9 |
| San Jose, CA | $17.55 | 98%, No. 39 (tie) |
| Washington, DC | $17.50 | 68%, No. 18 (tie) |
| Los Angeles, CA | $17.27 | 70%, No. 20 (tie) |
| San Diego, CA | $16.85 | 80%, No. 27 |
| Sacramento, CA | $16.00 | 64%, No. 13 (tie) |
| Riverside, CA | $16.00 | 67%, No. 17 |
| New York, NY | $16.00 | 84%, No. 30 (tie) |
Regardless of what they make or the local rate, the public is overwhelmingly in favor of hiking the minimum wage. Roughly 81% of those surveyed by Clever believe the federal government should raise the nationwide minimum wage, with the same amount saying their local government should do the same.
Big Gaps Exist Between Minimum Wage and Necessary Earnings
It’s clear that current minimum wage levels fall short of what’s needed for affordable living, but many have no idea just how short it truly is.
Even if every metro in the nation increased the minimum wage by $10 per hour, a single minimum-wage worker could only affordably rent a one-bedroom apartment in five of the 50 largest cities. These are Buffalo, St. Louis, Cincinnati, Cleveland, and Hartford.
Even more astounding, 19 cities have a minimum wage of at least $20 less than what would be required for a single person to affordably rent a one-bedroom apartment.
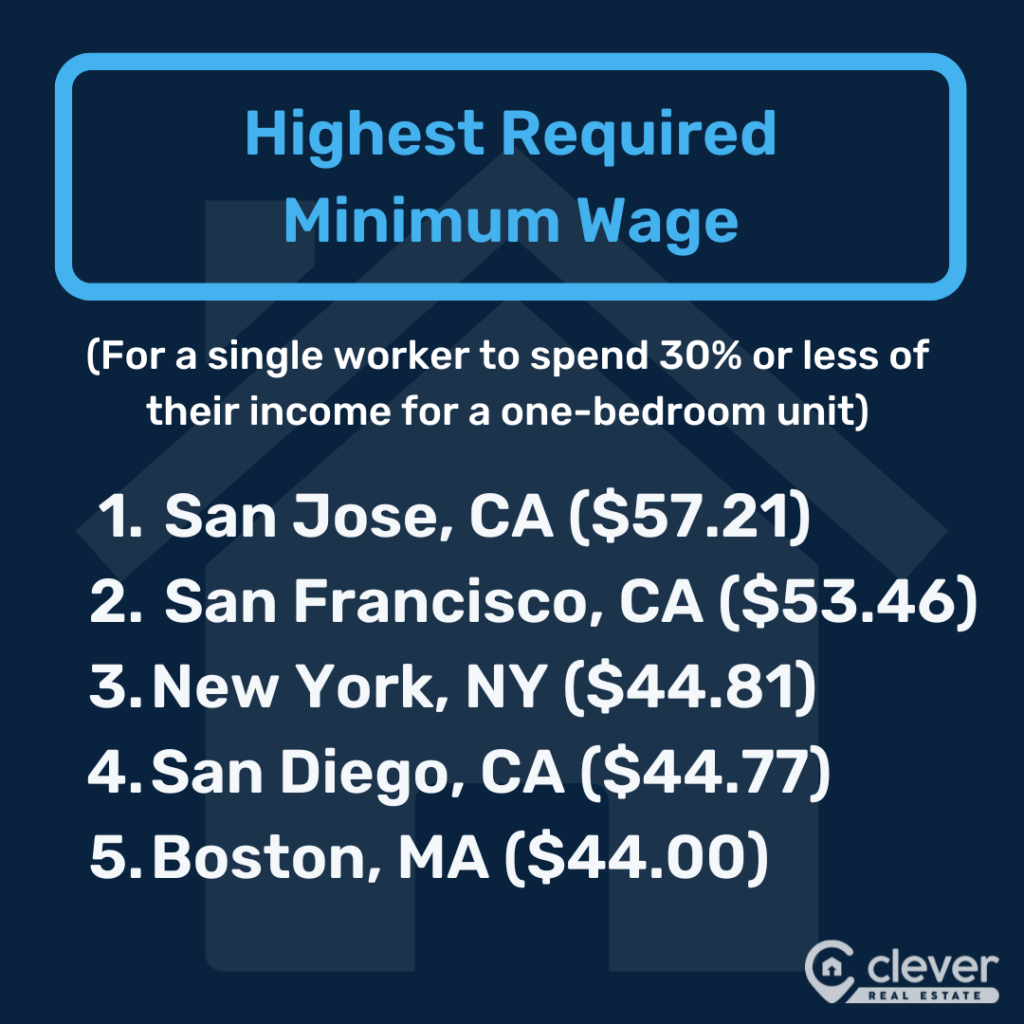
San Jose, California, has by far the widest gap between the local minimum wage and the required amount to affordably rent a one-bedroom unit. Despite earning $17.55 per hour — over $10 more than the federal rate — minimum-wage workers make a stunning $39.66 less than necessary.
Nearby San Francisco isn’t far behind at $32.50 short, followed by Boston ($29 short) and New York City ($28.81 short).
| Ranking | City | Minimum Wage (Hourly) | Required Wage (Hourly) | Difference |
| 1 | San Jose, CA | $17.55 | $57.21 | -$39.66 |
| 2 | San Francisco, CA | $20.96 | $53.46 | -$32.50 |
| 3 | Boston, MA | $15.00 | $44.00 | -$29.00 |
| 4 | New York, NY | $16.00 | $44.81 | -$28.81 |
| 5 | San Diego, CA | $16.85 | $44.77 | -$27.92 |
| 6 | Atlanta, GA | $7.25 | $31.79 | -$24.54 |
| 7 | Miami, FL | $12.00 | $36.50 | -$24.50 |
| 8 (tie) | Nashville, TN | $7.25 | $31.73 | -$24.48 |
| 8 (tie) | Austin, TX | $7.25 | $31.73 | -$24.48 |
| 10 | Charlotte, NC | $7.25 | $31.67 | -$24.42 |
| 11 | Seattle, WA | $19.97 | $44.10 | -$24.13 |
| 12 | Dallas, TX | $7.25 | $30.88 | -$23.63 |
| 13 | Raleigh, NC | $7.25 | $30.62 | -$23.37 |
| 14 | Los Angeles, CA | $17.27 | $40.02 | -$22.75 |
| 15 | Washington, DC | $17.50 | $39.54 | -$22.04 |
| 16 | Philadelphia, PA | $7.25 | $29.08 | -$21.83 |
| 17 | Orlando, FL | $12.00 | $33.21 | -$21.21 |
| 18 | Salt Lake City, UT | $7.25 | $27.94 | -$20.69 |
| 19 | Tampa, FL | $12.00 | $32.42 | -$20.42 |
| 20 | Riverside, CA | $16.00 | $35.62 | -$19.62 |
| 21 | Sacramento, CA | $16.00 | $34.17 | -$18.17 |
| 22 | Phoenix, AZ | $14.35 | $32.29 | -$17.94 |
| 23 | Richmond, VA | $12.00 | $29.71 | -$17.71 |
| 24 | Portland, OR | $15.95 | $33.65 | -$17.70 |
| 25 | Houston, TX | $7.25 | $24.60 | -$17.35 |
| 26 (tie) | New Orleans, LA | $7.25 | $23.77 | -$16.52 |
| 26 (tie) | Virginia Beach, VA | $12.00 | $28.52 | -$16.52 |
| 28 | San Antonio, TX | $7.25 | $23.67 | -$16.42 |
| 29 | Las Vegas, NV | $12.00 | $28.38 | -$16.38 |
| 30 | Denver, CO | $18.29 | $34.40 | -$16.11 |
| 31 | Chicago, IL | $14.00 | $30.00 | -$16.00 |
| 32 (tie) | Memphis, TN | $7.25 | $23.21 | -$15.96 |
| 32 (tie) | Jacksonville, FL | $12.00 | $27.96 | -$15.96 |
| 34 | Baltimore, MD | $15.00 | $30.85 | -$15.85 |
| 35 | Birmingham, AL | $7.25 | $22.00 | -$14.75 |
| 36 | Indianapolis, IN | $7.25 | $21.10 | -$13.85 |
| 37 | Louisville, KY | $7.25 | $21.04 | -$13.79 |
| 38 | Pittsburgh, PA | $7.25 | $20.54 | -$13.29 |
| 39 | Milwaukee, WI | $7.25 | $20.31 | -$13.06 |
| 40 | Columbus, OH | $10.45 | $22.96 | -$12.51 |
| 41 | Providence, RI | $14.00 | $25.37 | -$11.37 |
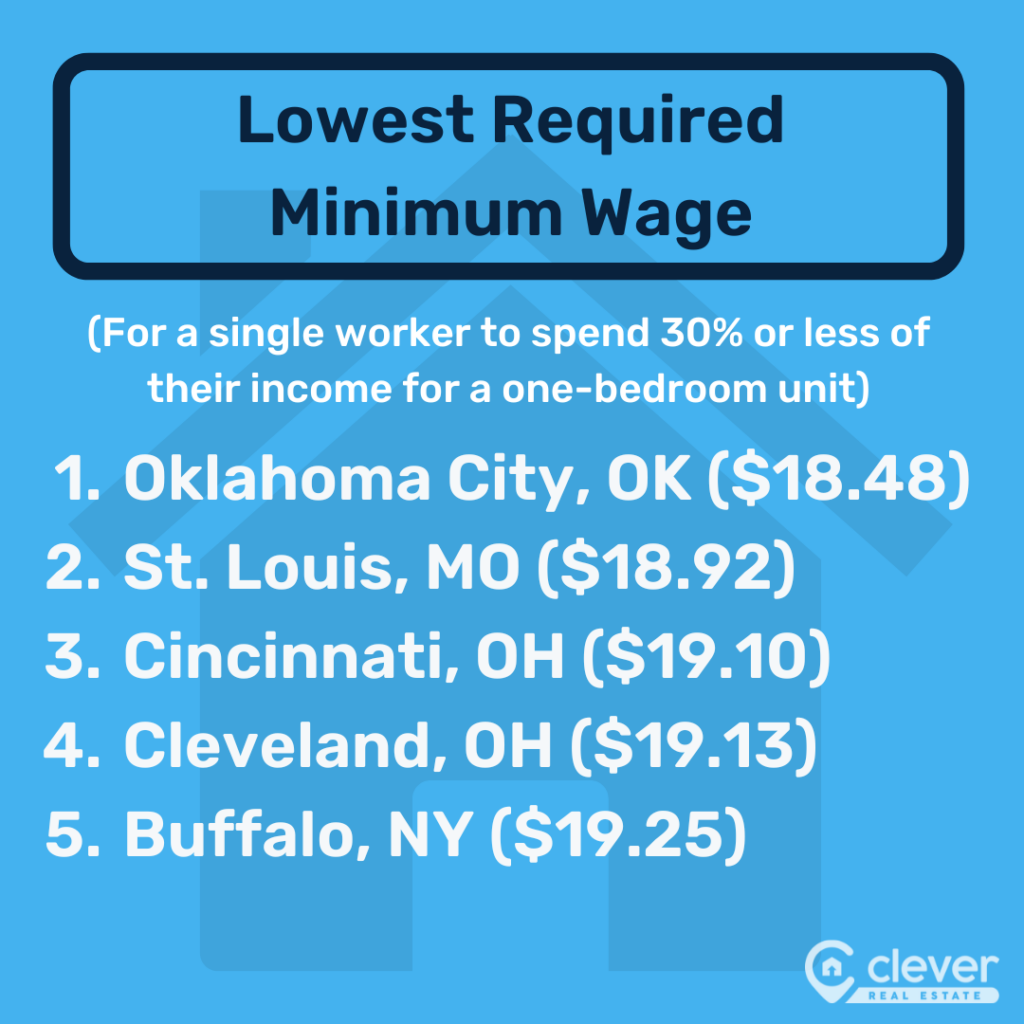
| 42 | Oklahoma City, OK | $7.25 | $18.48 | -$11.23 |
| 43 | Minneapolis, MN | $15.57 | $26.56 | -$10.99 |
| 44 | Detroit, MI | $10.33 | $20.96 | -$10.63 |
| 45 | Kansas City, MO | $12.30 | $22.75 | -$10.45 |
| 46 | Hartford, CT | $15.69 | $25.12 | -$9.43 |
| 47 | Cleveland, OH | $10.45 | $19.13 | -$8.68 |
| 48 | Cincinnati, OH | $10.45 | $19.10 | -$8.65 |
| 49 | St. Louis, MO | $12.30 | $18.92 | -$6.62 |
| 50 | Buffalo, NY | $15.00 | $19.25 | -$4.25 |
How Much Can Minimum-Wage Workers Afford?
Although it’s often more complex and time intensive, cities can also become more affordable by finding ways to lower the typical rent to levels minimum-wage workers can afford. Unfortunately, most would have a lot of work to do based on current conditions.
Residents in the 20 cities that pay only the federal minimum wage of $7.25 will have the smallest budgets. With a monthly income of roughly $1,257 before taxes, a single person earning the federal minimum wage could afford to spend $377 on rent, while a couple could afford to spend $754, based on the 30% rule.
Those meager amounts are several hundred dollars less than typical rent in even the country’s lowest-cost markets.
In Oklahoma City, the most affordable city that pays the federal minimum wage, the monthly rent on a studio apartment averages $886. That's more than double what a single worker could afford and over $100 more than a pair could.
Workers in San Francisco earn the highest minimum wage of $20.96, but that doesn't make renting more affordable.
Although a single minimum-wage worker could affordably pay $1,090 and a pair could pay $2,180, studio apartments in the city average $2,275 per month, and a typical one-bedroom apartment averages $2,780.
| Ranking | City | Current Fair Market 1BR Rent (Monthly) | Affordable Minimum Wage Rent (Monthly)* | Difference |
| 1 | San Jose, CA | $2,975 | $913 | -$2,062 |
| 2 | San Francisco, CA | $2,780 | $1,090 | -$1,690 |
| 3 | Boston, MA | $2,288 | $780 | -$1,508 |
| 4 | New York, NY | $2,330 | $832 | -$1,498 |
| 5 | San Diego, CA | $2,328 | $876 | -$1,452 |
| 6 | Atlanta, GA | $1,653 | $377 | -$1,276 |
| 7 | Miami, FL | $1,898 | $624 | -$1,274 |
| 8 (tie) | Nashville, TN | $1,650 | $377 | -$1,273 |
| 8 (tie) | Austin, TX | $1,650 | $377 | -$1,273 |
| 10 | Charlotte, NC | $1,647 | $377 | -$1,270 |
| 11 | Seattle, WA | $2,293 | $1,038 | -$1,255 |
| 12 | Dallas, TX | $1,606 | $377 | -$1,229 |
| 13 | Raleigh, NC | $1,592 | $377 | -$1,215 |
| 14 | Los Angeles, CA | $2,081 | $898 | -$1,183 |
| 15 | Washington, DC | $2,056 | $910 | -$1,146 |
| 16 | Philadelphia, PA | $1,512 | $377 | -$1,135 |
| 17 | Orlando, FL | $1,727 | $624 | -$1,103 |
| 18 | Salt Lake City, UT | $1,453 | $377 | -$1,076 |
| 19 | Tampa, FL | $1,686 | $624 | -$1,062 |
| 20 | Riverside, CA | $1,852 | $832 | -$1,020 |
| 21 | Sacramento, CA | $1,777 | $832 | -$945 |
| 22 | Phoenix, AZ | $1,679 | $746 | -$933 |
| 23 (tie) | Richmond, VA | $1,545 | $624 | -$921 |
| 23 (tie) | Portland, OR | $1,750 | $829 | -$921 |
| 25 | Houston, TX | $1,279 | $377 | -$902 |
| 26 (tie) | New Orleans, LA | $1,236 | $377 | -$859 |
| 26 (tie) | Virginia Beach, VA | $1,483 | $624 | -$859 |
| 28 | San Antonio, TX | $1,231 | $377 | -$854 |
| 29 | Las Vegas, NV | $1,476 | $624 | -$852 |
| 30 | Denver, CO | $1,789 | $951 | -$838 |
| 31 | Chicago, IL | $1,560 | $728 | -$832 |
| 32 | Memphis, TN | $1,207 | $377 | -$830 |
| 33 | Jacksonville, FL | $1,454 | $624 | -$830 |
| 34 | Baltimore, MD | $1,604 | $780 | -$824 |
| 35 | Birmingham, AL | $1,144 | $377 | -$767 |
| 36 | Indianapolis, IN | $1,097 | $377 | -$720 |
| 37 | Louisville, KY | $1,094 | $377 | -$717 |
| 38 | Pittsburgh, PA | $1,068 | $377 | -$691 |
| 39 | Milwaukee, WI | $1,056 | $377 | -$679 |
| 40 | Columbus, OH | $1,194 | $543 | -$651 |
| 41 | Providence, RI | $1,319 | $728 | -$591 |
| 42 | Oklahoma City, OK | $961 | $377 | -$584 |
| 43 | Minneapolis, MN | $1,381 | $810 | -$571 |
| 44 | Detroit, MI | $1,090 | $537 | -$553 |
| 45 | Kansas City, MO | $1,183 | $640 | -$543 |
| 46 | Hartford, CT | $1,306 | $816 | -$490 |
| 47 | Cleveland, OH | $995 | $543 | -$452 |
| 48 | Cincinnati, OH | $993 | $543 | -$450 |
| 49 | St. Louis, MO | $984 | $640 | -$344 |
| 50 | Buffalo, NY | $1,001 | $780 | -$221 |
Rankings by Category
Real Estate Stats by State
Methodology
For the analysis above, Clever Real Estate evaluated data from the Department of Housing and Urban Development, the Labor Department, the City of Baltimore, the City of Denver, Los Angeles County, the Missouri Department of Labor, the City of Minneapolis, the City of San Diego, the City of San Jose, the City of Seattle, and the City of Washington, D.C. When minimum-wage levels differed within a metro area, rates in the city proper were used.
About Clever
Since 2017, Clever Real Estate has been on a mission to make selling or buying a home easier and more affordable for everyone. Twelve million annual readers rely on Clever's library of educational content and data-driven research to make smarter real estate decisions, and to date, Clever has helped consumers save more than $82 million on Realtor fees. Clever's research has been featured in The New York Times, Business Insider, Inman, Housing Wire, and many more.
More Research From Clever


Articles You May Like


FAQs
What is the best rent-to-income ratio?
Many financial experts recommend that no more than 30% of a person’s gross income should be spent on housing. However, some argue this number isn’t always realistic, particularly for very low or high earners. Learn more.
Where is the minimum wage the highest and lowest?
The highest minimum wage is in San Francisco, where it’s set at $20.96 per hour. The minimum wage is the lowest in the 20 states that pay the federal minimum of $7.25 hourly. Learn more.
Where can minimum-wage workers afford a one-bedroom rental? The rent on a one-bedroom apartment ($1,001) eats up just 39% of a full-time minimum-wage income in Buffalo ($2,600 per month). However, none of the 50 cities studied offer one-bedroom units that cost 30% or less of the local monthly minimum wage income, a common standard for affordability. Learn more.