

| 🚙 What is the average commute time in America? 🚙The average worker commutes a total of 28 minutes one-way to work. In the average U.S. metro, workers spend an average of 239 hours every year commuting – amounting to 3% of their year in total! |
Best Cities for Commuters, Ranked | Top 15 Cities for Commuters | Top 5 Cities by Category | Calculate Your Commute | 10 Worst Cities for Commuters | Methodology | FAQ
It's no lie – remote work is here to stay. But that doesn't mean that every employer is taking advantage of post-COVID work culture. Today, many companies are transitioning to a permanent system of remote or hybrid work – but not all.
Although some industries are conducive to working from home, some fields require in-person labor, such as manufacturing, retail, or health care. But with gas prices the highest they've ever been, inflation seeing the largest year-over-year spike since 1981, and used vehicle prices leaping 41% since 2021, is the average worker really able to afford their commute?[1][2][3]
To find out, we analyzed data from the U.S. Bureau of Labor Statistics, the U.S. Department of Transportation Federal Highway Administration, the U.S. Census, the American Automobile Association, the Brookings Institute, INRIX, GasBuddy, and The Zebra.
We found that the average commuter in the U.S. spends $8,466 and about 19% of their annual income on their commute every year. As part of that overall cost, the average commuter spends $867 on fuel and $410 on vehicle maintenance each year as a result of commuting. Additionally, the average driver in America loses 32 hours to traffic annually.
Our weighted rankings evaluated various criteria including:
- 4x: How much of their income does the average commuter spend on commuting every year?
- 2x: How much money does the average commuter spend on fuel per year?
- 2x: How much money does the average commuter spend on maintenance per year?
- 2x: How much potential income is lost to time spent commuting to work (opportunity cost)?
- 1x: Average hours per year lost to traffic or congestion.
- 1x: How far is the average commute in this metro?
- 1x: The average annual cost of insurance in the metro area.
- 1x: Average minutes spent commuting to work one-way.
- 1x: Average MPH achieved during commute: Lower MPH means you're spending a lot of time going a short distance.
To learn more about how we defined each metric, check out the methodology section.
Best Cities for Commuters Stats 🛣️
|
The 50 Best (and Worst) Cities for Commuters, Ranked
| Based on the numbers, commuters fare the best further East and in some places in the Midwest, where commutes are relatively cheaper and less time-consuming, insurance costs are lower, and the roads are less congested. |
Top 15 Cities for Commuters
Most cities that made our top 15 have the lowest commuting costs, meaning residents spend less money and time driving to and from work every year. But how do they stack up against the average metro in the U.S.?
| Annual Fuel Cost | Annual Maintenance Cost | Annual Opportunity Cost | Total Annual Cost to Commute | % of Annual Income Spent on Commuting | Annual Hours Spent Commuting | Annual Hours Lost to Traffic | |
| Top 15 Metros | $743 | $374 | $4,346 | $6,993 | 19% | 211 | 12 |
| Average Metro | $867 | $410 | $5,190 | $8,467 | 19% | 239 | 32 |
| Bottom 10 Metros | $1,054 | $469 | $6,393 | $10,359 | 22% | 277 | 58 |
Overall, the top 15 metros have an 18% cheaper total cost to commute every year ($6,993) than the average metro ($8,467). Additionally, the average total cost to commute in the U.S. has increased by 8% since 2019, rising from $7,855 to $8,467 in 2022.
Want to know how much your commute is costing you every year in any of the top 50 metro areas? Plug in your info below to find out! 👇1. Buffalo, New York
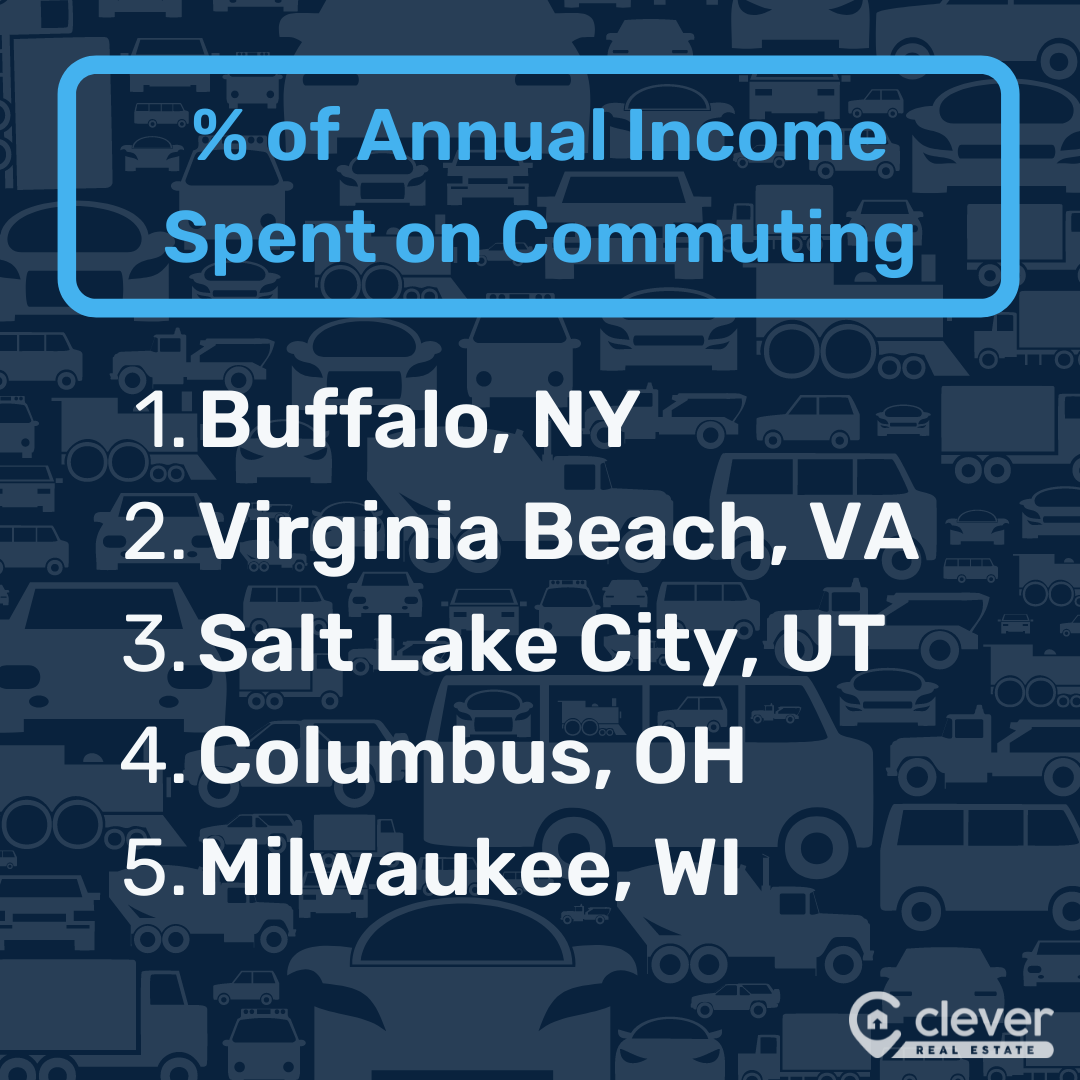
| 🥇 Gold Pedal CityIn America's best city for commuters, drivers spend the least amount of their annual income on their commute – 15% compared to 19% in the average city in our study, a 21% discount. |
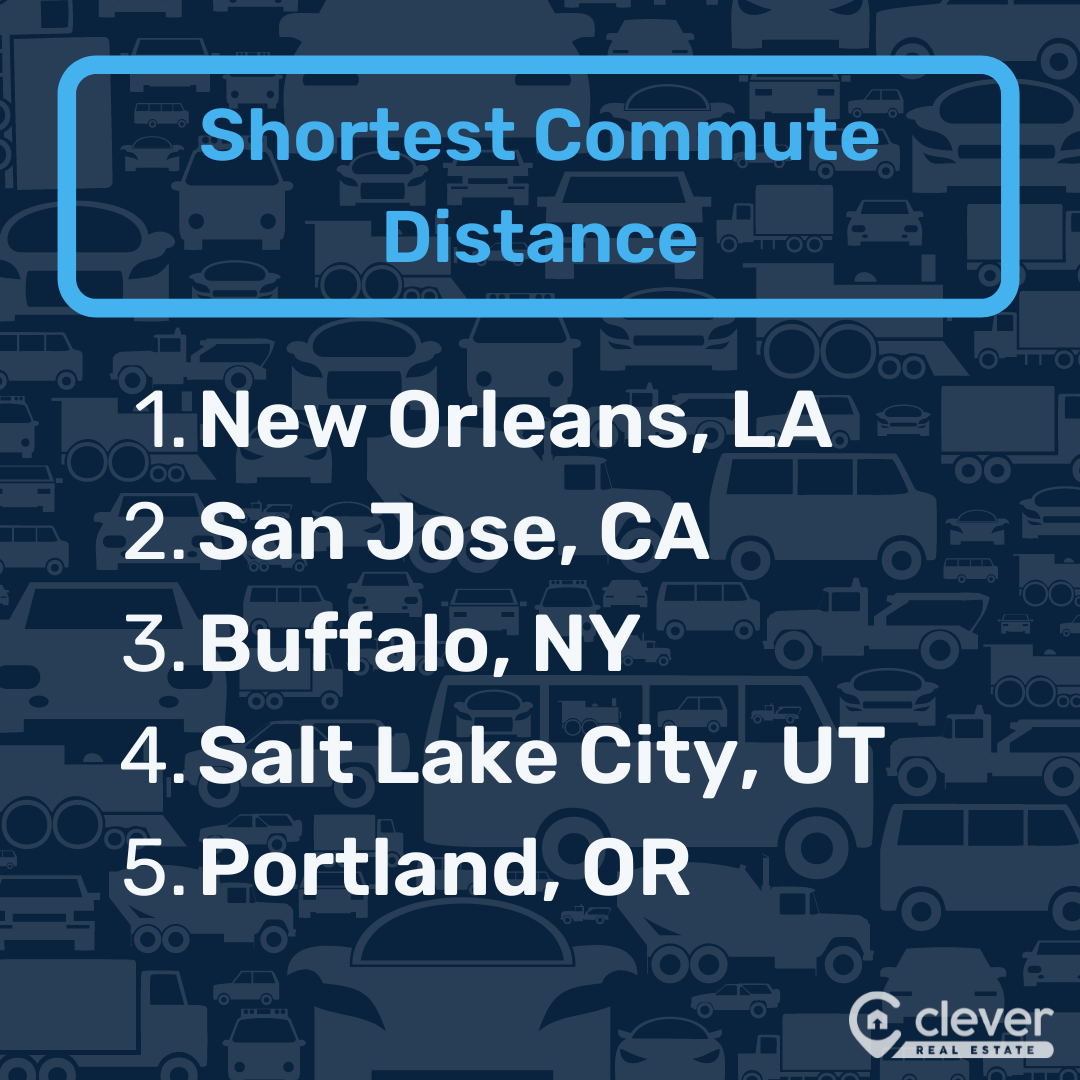
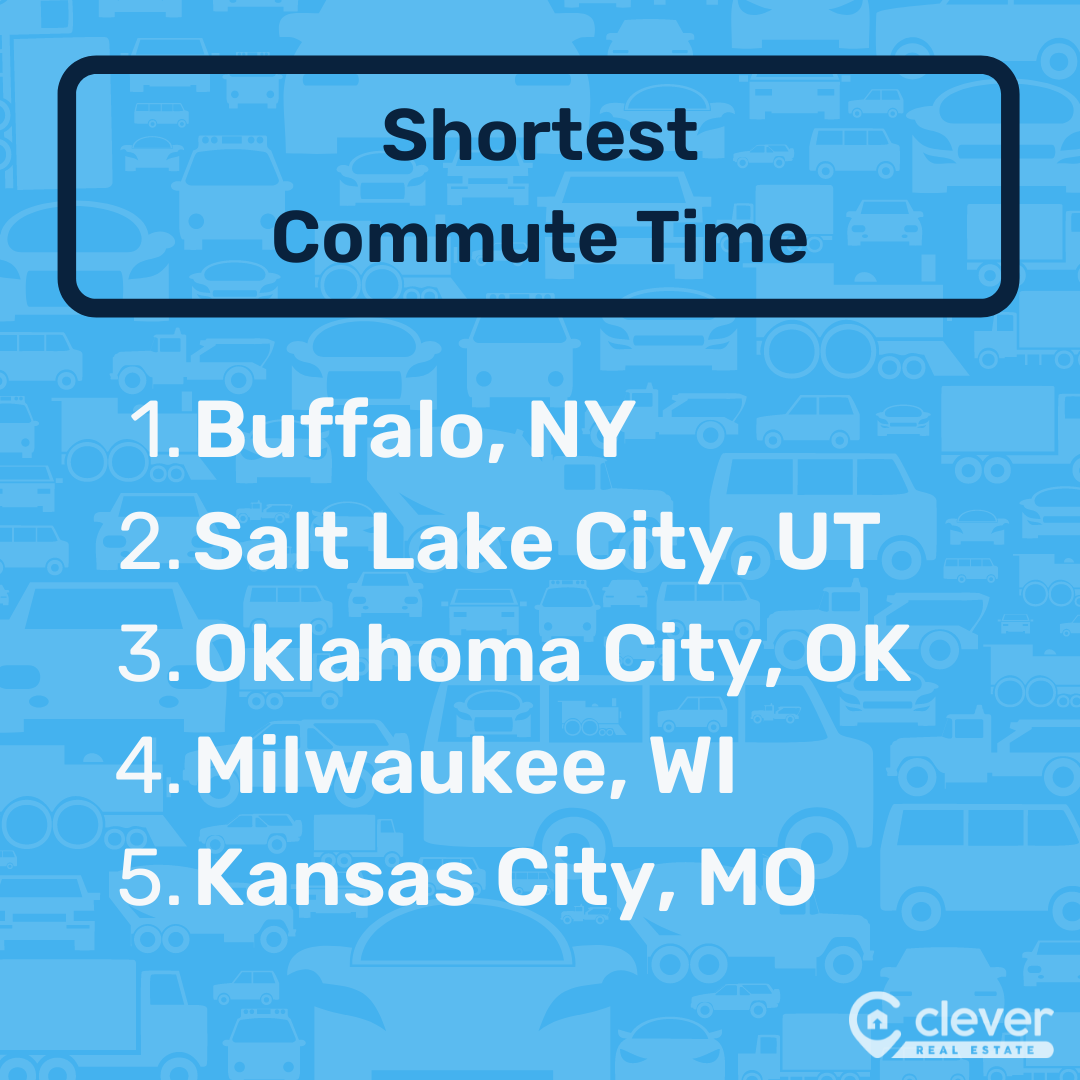
In addition to one of the cheapest annual commutes, the average commuter in Buffalo travels just 22 minutes to work one-way – the shortest commute time across all cities in our study.
The average commute in the City of Good Neighbors is just 6.5 miles to work one-way, compared to 8.77 in the average city, 26% less. Buffalo drivers also lose 81% less of their time to traffic every year compared to commuters in the average city, losing just 6 hours annually compared to 32 hours in the average metro in our study.
» Learn About New York Real Estate
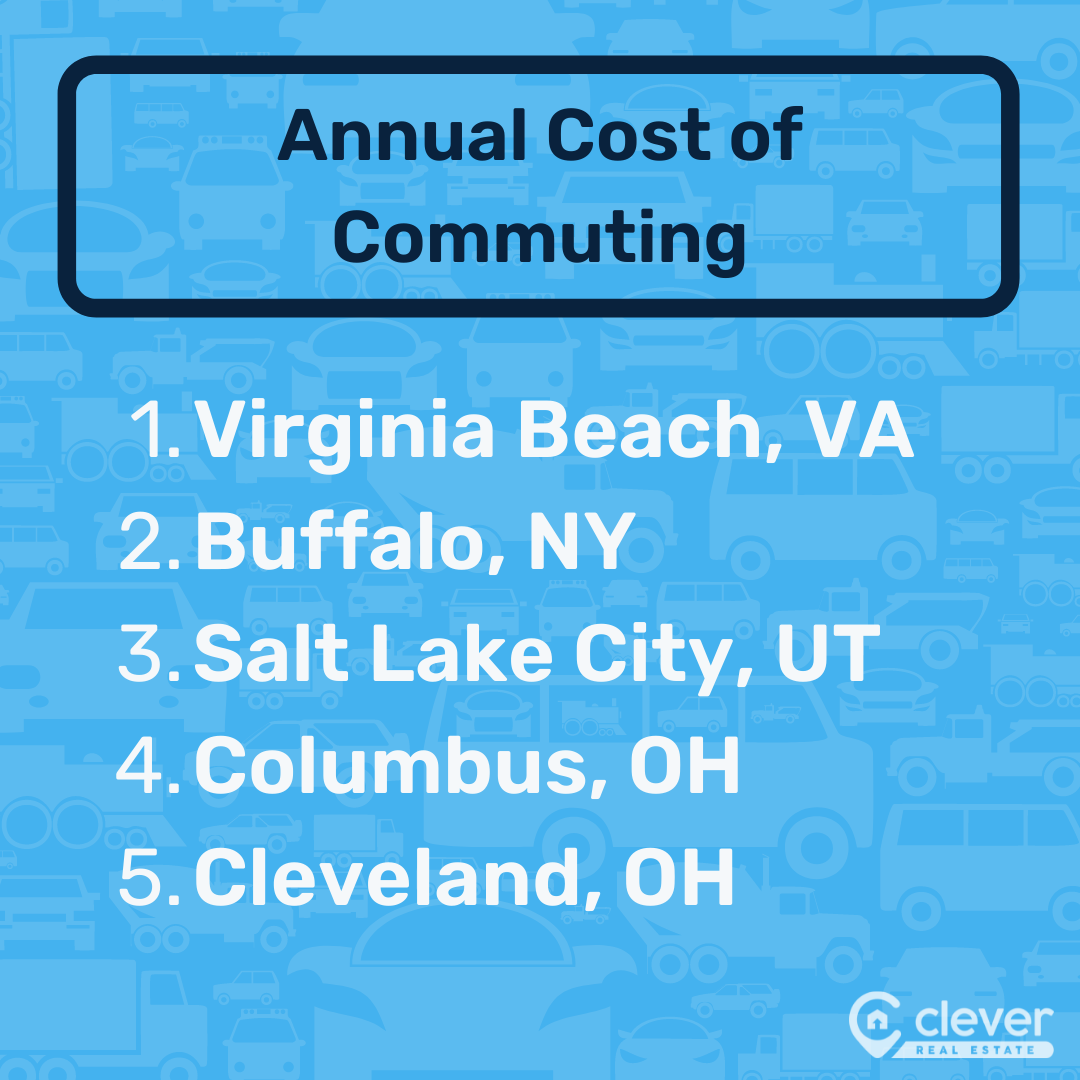
2. Salt Lake City, Utah
| ⛽ Best in GasSLC ranks No. 3 for lowest annual fuel costs: Commuters in the City of Saints spend $648 per year on fuel – 25% less than commuters in the average city ($867). |
Commuters in Salt Lake City don't drive too far to work, either. The average commute distance in SLC is 6.5 miles one-way, compared to 8.8 in the average metro. Salt Lake City drivers also lose 69% less time to traffic per year than drivers in the average metro, losing an average of just 10 hours annually compared to 32 hours in the average city in our study.
With the average distance to work so short, Salt Lake City residents don't have to sweat massive maintenance costs. The average commuter there spends $304 per year on maintaining their vehicle as a result of commuting – 26% less than commuters spend in the average city in our study ($410).
» Learn About Utah Real Estate
3. Milwaukee, Wisconsin
| ⏱️ Quick CommutingBrew City has fermented itself into fourth place for time spent commuting work, with the average commute spanning just 23 minutes one-way, compared to 28 minutes in the average metro – 16% less. |
Impressively, Milwaukee has maintained its place among the top cities for commuters since our last analysis in 2019. Milwaukee maintenance costs have decreased 23% over the past three years – dropping from $450 to $346. Commuters in Milwaukee also spend just 16% of their annual income commuting — compared to the average metro at 19%, that's a 16% discount.
Among affordability and consistency, Milwaukeeans can also boast less congested roads. Drivers in Brew City lose 31% fewer hours to traffic annually (22) than drivers in the average city, who lose 32 hours to congestion every year.
» Learn About Wisconsin Real Estate
4. Virginia Beach, Virginia
| 💰 The Wheel DealResort City is No. 1 for commute cost, with workers spending just $6,367 to commute every year - 25% less than the $8,466 commuters in the average city spend. |
Since 2019, the Virginia Beach commute has gotten significantly cheaper, decreasing by 11%. While workers previously shelled out $7,159 every year for their commutes, traveling to and from work in Virginia Beach now costs about $6,367 every year.
Consequently, Virginia Beach is now in second place for commuting cost as a percent of annual income: Commuters spend just 15% of their income on commuting every year as opposed to 19% in the average metro area. Additionally, Virginia Beach drivers experience 72% less traffic every year compared to the average metro – an average of just 9 hours every year versus 32 average hours in the average city in our study.
» Learn About Virginia Real Estate
5. Cleveland, Ohio
| 💯 Driving for ExcellenceSince 2019, the cost of maintenance in Cleveland has been driven down by 23% from $477 to $365. |
In addition to decreased maintenance costs, Cleveland commuters can drive easy knowing their average annual insurance premium is 38% less expensive than the average metro – just $1,235 compared to $2,000 every year.
Although workers in Cleveland spend an average of 215 hours commuting every year, they're still saving on annual commuting costs. The average Cleveland commute costs $6,745 every year compared to $8,466 in the average metro – a 20% discount. Even more, Cleveland drivers lose 53% less time every year to traffic than drivers in the average metro – 15 hours every year compared to 32 in the average city in our study.
» Learn About Ohio Real Estate
6. Columbus, Ohio
| 🔥 Ahead of the SwerveColumbus ranks No. 4 for the percent of the average worker's annual income spent on commuting costs. Commuters in Arch City spend 16% of their income on commuting every year, compared to 19% in the average city, a 16% discount. |
Columbus honors its history as a major railhead and transit center in 1888
through care for commuters. Arch City workers lose nearly 59% less time to traffic annually than commuters in the average metro – just 13 hours compared to 32.
Commuters in Columbus also spend just $6,602 on their commutes. In contrast, we found that workers in the average city in our study spend an average of $8,466 commuting every year – 28% more than workers in Columbus spend. In general, driving costs in Columbus are significantly cheaper: The average Arch City driver spends $1,170 on insurance premiums per year, 42% less than the $2,000 in the average metro.
7. Hartford, Connecticut
| 🌟 Raising the CarHartford ranks No. 5 for annual fuel cost ($706) and No. 7 for time to work (24 minutes), meaning local commuters are saving money and time in New England's Rising Star. |
Hartford is speeding ahead of other metros when it comes to affordability. Not only has the annual fuel cost for commuters in Hartford decreased 20% from 2019 (dropping from $880 to $706), but the annual maintenance cost for commuters is also now $342 every year – a 46% drop from $633 in 2019.
In turn, Hartford workers only spend 16% of their annual income on their commutes and lose less than a full day to traffic every year (21 hours annually compared to 32 hours in the average metro area). Compared to the average metro, where commuters spend 239 hours every year traveling to and from work, Hartford commuters spend just 210 hours – 12% less.
» Learn About Connecticut Real Estate
8. Oklahoma City, Oklahoma
| 🕑 In Wheel TimeOklahoma City ranks No. 3 for time spent commuting. Workers in OKC spend just 198 hours every year traveling to and from work. Compared to 239 hours in the average metro, that's a 17% time discount. |
Since 2019, the average commute to work in Oklahoma City has decreased by 12%, shrinking from 26 to 23 minutes one-way. And speaking of time, Oklahoma City drivers have significantly more. Every year OKC drivers lose an average of 10 hours to traffic and congestion – 69% less than drivers in the average metro, who lose 32 hours annually.
Maintenance costs are also down 23% in The Big Friendly, as commuters can expect their drives to and from work to cost them $402 every year in maintenance compared to $522 in 2019.
» Learn About Oklahoma Real Estate
9. Cincinnati, Ohio
| ✨ Golden GearsCommuters in Cincy have seen annual maintenance costs due to commuting drop 23% since 2019, going from $528 to $407 in three years. |
Cincinnati is the third Ohio metro to make our top 15 list – and for good reason. Since 2019, a one-way commute in Cincinnati has decreased in time by 11% – from 28 minutes to 25 minutes. Even more, the total cost to commute for Cincinnatians has also dropped from $7,089 in 2019 to $6,762 this year.
Cincinnati workers also spend just 16% of their annual income on commuting every year compared to 19% in the average metro in our study. But annual driving times are also on discount, as drivers in The Queen City are losing just 13 hours to traffic every year compared to 32 hours in the average metro – a 59% discount.
10. Raleigh, North Carolina
| 🏎💨 Speeding AheadRaleigh ranks No. 1 for average annual car insurance premium, as drivers spend an average of $952 every year on car insurance - 52% less than the $2,000 drivers spend in the average city. |
Raleigh commuters have seen significant savings over the past 3 years. The total yearly commuting cost for Raleigh workers has decreased 6% since 2019 – declining from $7,430 to $6,984 this year. Meanwhile, the maintenance cost due to commuting has decreased 18%, plunging from $485 in 2019 to $398 in 2022.
In addition to spending less money, drivers in the City of Oaks also spend less time behind the wheel every year. Raleigh ranks No. 2 for annual hours lost to traffic, meaning drivers lose just 6 hours to traffic and congestion each year – 81% less than the 32 hours drivers lose in the average metro.
» Learn About North Carolina Real Estate
11. Richmond, Virginia
| 🚘 Discount DrivingAmong all metros in our study, Richmond has seen the biggest price drop since 2019 for total commuting costs. While Richmond commuters used to spend $8,690 every year on commuting costs, the average RVA worker now spends $6,891 – a 21% decrease. |
Even across other commuting metrics, Richmond has seen prices plummet. The annual maintenance cost to commute decreased 57% over the last three years (from $937 in 2019 to $407 today), and annual fuel costs are down 28% (from $1,133 in 2019 to $812 today).
Richmond drivers also spend less time on the highway than drivers in other metros, losing just 10 hours to traffic every year compared to the 32 hours lost in the average metro – a 32% time discount.
12. Kansas City, Missouri
| 🫀 Beating Out the Competition Commuters in the Heart of America spend just 204 hours every year traveling to and from work – 15% less time than workers in the average metro lose to their commutes each year (239 hours). |
Kansas City ranks among our best cities for commuters for many reasons but especially for time spent on the road. The average commute in Kansas City is just 24 minutes, and drivers spend just 13 hours out of their year in traffic compared to the average metro in our study, where workers commute an average of 28 minutes one-way and lose 32 hours to traffic every year. That's 146% more time lost to traffic than in Kansas City!
Costs associated with commuting in KC are comparatively cheaper today. Maintenance costs as a result of commuting have decreased by 17% since 2019, dropping from $501 to $417 and hopefully leaving money in the average Kansas Citian's pocket. Overall, the average commuter in Kansas City spends $7,404 every year on commuting – 13% less than workers in the average metro ($8,466).
» Learn About Missouri Real Estate
13. Louisville, Kentucky
| 🛣️ Greatway to the SouthLouisville ranks No. 3 for annual hours lost to traffic: Drivers there lose just 7 hours every year to road congestion. Compared to the average metro, where the average driver spends 32 hours every year in traffic, that's a 78% discount. |
Known by many names such as Derby City or River City, Louisville is making yet another name for itself as a great place to drive. The metro ranks No. 6 for annual fuel costs due to commuting, with the average worker spending $714 on gasoline every year – 18% less than a commuter spends in the average metro ($867).
River City commuters also spend less time commuting. Louisville ranks No. 7 for hours spent commuting every year, as the average Louisville worker expends 210 hours annually traveling to and from work. That's 12% less than commuters spend in the average metro (239 hours).
» Learn About Kentucky Real Estate
14. Pittsburgh, Pennsylvania
| 💸 Insuring ExcellenceDrivers in Pittsburgh spend more than a quarter (26%) less on car insurance than drivers in the average metro in our study – $1,486 compared to $2,000 every year. |
Ranking within our top 15 metros, the City of Champions remains true to its name. And among the reasons Pittsburghians should celebrate is time saved!
Residents in Pittsburgh lose 43% less time to traffic every year – spending just 18 hours in traffic compared to the 32 hours drivers in the average metro spend. Pittsburgh commuters only spend 3% of their year (or 234 hours) driving to and from work and also have a 16% shorter commute to work (27 minutes) than all of the bottom 10 cities combined (32 minutes).
» Learn About Pennsylvania Real Estate
15. Indianapolis, Indiana
| 🚙 Going the DistanceCommuters in Indianapolis spend 19% less on their annual commuting costs than residents in the average metro, spending $6,892 every year compared to $8,466 nationwide. |
Indy drivers can count their savings in not only dollars but hours, too. The average driver in Indianapolis spends 14 hours in traffic every year. Compared to drivers in the average metro, who lose 32 hours to congestion every year, that's a 56% discount.
Additionally, commuters in Indianapolis spend just 17% of their annual income on their commutes – an 11% discount from the 19% of their annual income drivers in the average metro spend every year. Even more, Indy drivers spend 36% less on car insurance each year than drivers in the average metro (just $1,284 compared to $2,000).
» Learn About Indiana Real Estate
Best Cities by Category
 |
 |
 |
 |
 |
 |
The 10 Worst Cities For Commuters
Not every metro is speeding ahead in terms of affordability. Of the 50 most populous metros, these 10 were the least ideal for commuters:
- Detroit, Michigan
- Atlanta, Georgia
- New York City, New York
- Riverside, California
- Los Angeles, California
- San Francisco, California
- Chicago, Illinois
- Houston, Texas
- Washington, District of Columbia
- Dallas, Texas
The worst 10 cities for commuters cost workers more time and money. Altogether, they have an average annual commute cost of $10,359, compared to $8,466 in the average metro – a 22% increase. As a result, residents in the bottom 10 cities spend 22% of their annual income on commuting, compared to 19% in the average metro, a 15% increase. Additionally, the average commuter in these metros spends an average of 277 hours every year commuting to work and loses 58 hours to traffic every year.
Motor City surprised us by coming in last place. Much of this is due to the high average annual car insurance cost and the high cost of commuting in general. The average Detroit resident spends a whopping $6,280 on car insurance every year – partly due to Michigan's status as a no-fault state – and commuters spend 29% of their annual income traveling to and from work. But even so, Detroit isn't nearly as congested as other metros: Residents lose 59% less time to traffic every year, spending just 13 hours in traffic annually versus 32 in the average city.
Methodology
Clever Real Estate compared the 50 most populous U.S. metro areas across 9 metrics, listed below. Each metric was normalized and graded on a 100-point scale. The combined weighted average of each score determined the overall "commuting city" score upon which the final ranking was based.
In cases where data sets included only cities, the city data was combined and weighted by population within the overall metro in which the city belonged. In cases where data sets included only counties, county data was crosswalked with metropolitan data. In cases where data sets included only states, the state where the largest portion of the metro is located was used.
The metrics used are as follows:
- The annual cost to commute as a percentage of the average income in each metro (28.6% of total)
- Annual fuel cost of a workday commute per resident (14.3% of total)
- Annual hours lost to traffic/congestion (7.1% of total)
- Annual maintenance cost of commuting (14.3% of total)
- Distance of commute (7.1% of total)
- Average annual insurance premium (7.1% of total)
- How much potential annual income is lost to time spent commuting to work (14.3% of total)
- Time to work (7.1% of total)
- Average miles per hour achieved during commute (7.1% of total)
Here's how we defined our metrics:
- Fuel: We estimated the cost of fuel by calculating the amount of gas used to commute to work (in gallons) by dividing the average distance to work by the average miles per gallon across all light-duty vehicles (22.9 MPG) then multiplied that by the average gas price per gallon.
- Maintenance: The cost of maintenance was calculated as the average cost of maintenance per mile (9 cents) multiplied by the average number of miles to work.
- Opportunity: We estimated the opportunity cost of a person’s time as the amount of money they could have earned had they been working instead of commuting by multiplying the average hourly wages by the number of hours spent commuting to work.
- Percent of income: We calculated the total cost to commute by adding the fuel, maintenance, insurance, and opportunity costs together. We then divided that by median annual income to determine how much of annual income is attributable to annual commute costs.
Article Sources
About Clever
Since 2017, Clever Real Estate has been on a mission to make selling or buying a home easier and more affordable for everyone. 12 million annual readers rely on Clever's library of educational content and data-driven research to make smarter real estate decisions—and to date, Clever has helped consumers save more than $82 million on realtor fees. Clever's research has been featured in The New York Times,
Business Insider, Inman, Housing Wire, and many more.
More Research/Related Articles


Frequently Asked Questions
What is the average commute time in the U.S.?
The average worker commutes a total of 28 minutes one-way to work. In the average U.S. metro, workers spend an average of 239 hours every year commuting – amounting to 3% of their year in total. Learn more about commute times and costs.
Which U.S. city has the longest commute time?
New York City has the longest commute time in the U.S., as the average worker in NYC travels 37 minutes one-way to work. That's 321 hours every year that NYC commuters spend traveling to and from work. Read more about the best (and worst) cities for commuters.
What is the average commuting distance in the U.S.?
The average commute across the 50 most populous cities in the U.S. is 9 miles, meaning the average commuter travels at least 18 miles every workday. Find out which metros have the shortest commutes.