
Homeownership is a long-term investment, with the typical mortgage lasting between 15 and 30 years; however, most home buyers don't consider the potential impact of climate change on their most important investment.
The reality is climate change could have a serious impact on how the real estate industry approaches property values and assesses risk.
Although climate change is a global phenomenon, its impact will not be the same across the globe. For instance, while some regions might have to contend with increased flooding, others might experience extreme heat waves or cold snaps.
Therefore, the effect of climate change will vary based on:
- The type of potential climate-related hazard
- The vulnerability of a location to that particular type of hazard
- How the location can adapt to that type of hazard (i.e. emergency readiness)
To understand how climate change will impact major cities across the United States, we gathered and analyzed available public data from Notre Dame Global Adaptation Initiative (ND-GAIN).
This dataset includes risk and readiness scores for extreme climate events (e.g., cold, heat, flood, drought, and sea-level rise) for over 270 U.S. cities, as well as the probability of a climate-related disaster occurring in 2040.
We looked at the 100 most populated cities reported in the dataset and developed a ranking system to identify which cities will be most affected by climate change. We then created an impact metric to look at how each city will be impacted by specific climate change-related disasters.
Here's what you need to know.
Key Findings
- The cities that are most vulnerable to climate change hazards are also the least prepared for them
- Coastal cities have higher risk scores relative to inland cities, meaning they are more vulnerable to climate change-related hazards
- Extreme heat is more likely to impact cities in Florida and the Midwest because they're at higher risk of heat waves and are more vulnerable to relative humidity
- Floods are more likely to impact cities in California and Texas because they are near large river basins
- Eastern and southern coastal cities are more likely to be affected by sea-level rise compared to western coastal cities
- Somewhat counter-intuitively, extreme cold is more likely to negatively impact cities in warmer states like Texas and California because they lack the requisite infrastructure
Terminology
Below are the general terminologies used in our study (you can find the exact definitions provided by ND-GAIN at the end of this study).
- Probability of an extreme climate event: For each city, an extreme climate event in 2040 is determined relative to that city’s historical average between 1950-1999. The threshold for an extreme event is set high by ND-GAIN, making it reasonably difficult to experience such an event.
- Risk: A city’s vulnerability to climate change. The risk score incorporates exposure, sensitivity and adaptive capacity based on the type of hazard.
- Readiness: A city's overall preparedness for a climate-related event. Readiness score is a function of economic, government, and social readiness and does not change based on the type of hazard (i.e., readiness score remains the same for each climate event).
We first present results regarding overall risk and readiness scores. We then examine each climate event separately and provide rankings based on the overall impact climate change will have on major U.S. cities.
City Risk vs. Readiness
Overall risk and readiness scores measure how well cities perform on all of the indicators, irrespective of the type of environmental hazard.
Ideally, we would want to observe a positive correlation between these measures: If a city is highly vulnerable, being prepared would help the city adapt to a climate-related hazard. Unfortunately, we found a significant negative correlation of -0.29 between risk and readiness scores, meaning as risk scores increased, readiness scores decreased.
In other words, the cities that are most vulnerable are also the ones that will be the least prepared for a climate-related disaster.
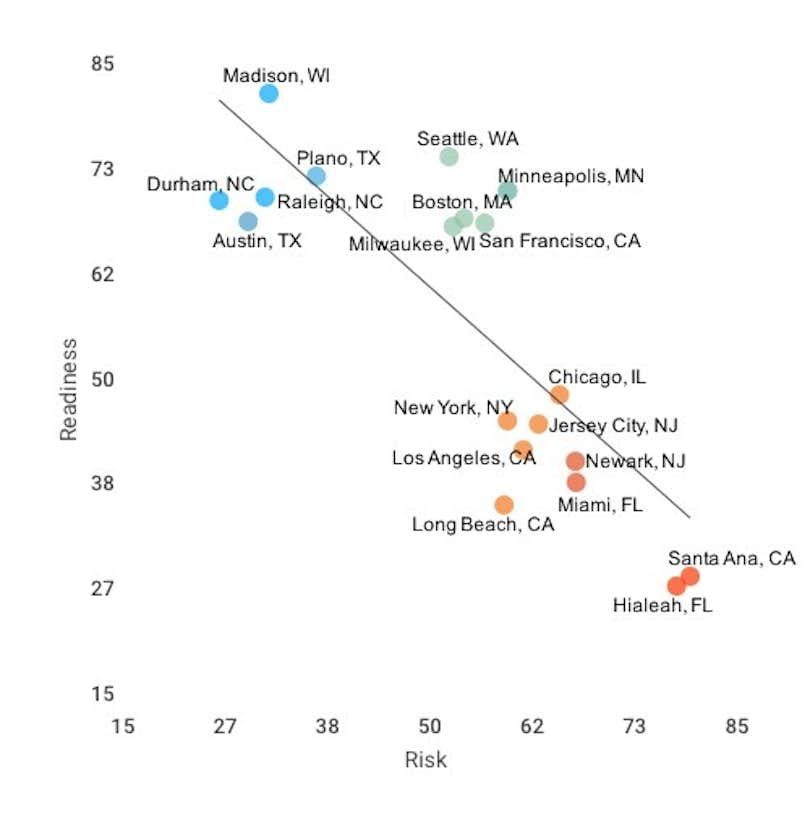
Cities at highest risk:
- Santa Ana, CA
- Hialeah, FL
- Miami, FL
- Newark, NJ
- Chicago, IL
Cities with highest degree of readiness:
- Madison, WI
- Seattle, WA
- Plano, TX
- Minneapolis, MN
- Raleigh, NC
Cities with lowest degree of readiness:
- Anaheim, CA
- San Bernardino, CA
- Hialeah, FL
- Santa Ana, CA
- Riverside, CA
Largest difference between risk and readiness scores:
- Santa Ana, CA
- Hialeah, FL
- Anaheim, CA
- Miami, FL
- Newark, NJ
Santa Ana, CA ranks as the most vulnerable city in the United States. This means that if a climate hazard occurs in Santa Ana, many people will be adversely affected — especially because Santa Ana has a relatively low adaptive capacity to respond to the impacts of such an event.
» Learn more about the current state of California's residential real estate market
Madison, WI ranks as the best-prepared city for extreme climate events in the United States. This means Madison has economic stability to adapt to extreme climate events, and the government system to support these adaptations. Furthermore, Madison has civil engagement and innovative capabilities that allow its residents to adjust to a more volatile environment.
» Learn more about the current state of Wisconsin's residential real estate market
Next, we identified cities with the biggest difference between risk rating and readiness: This metric helps us identify which cities are more vulnerable and less ready to adapt to climate-related events. When we rank the cities based on difference scores, Santa Ana again ranked as the top, followed by Hialeah, Anaheim, Miami, and Newark.
We also compared coastal cities and inland cities in terms of their risk and readiness scores. On average, coastal cities have statistically higher risk scores (49.4) than inland cities (40), meaning that coastal cities are more vulnerable to climate change. However, coastal and inland cities did not differ in their readiness scores.
This means coastal cities are more vulnerable and sensitive to climate change-related events than inland cities, but they show similar levels of preparedness.
Note: High risk does not mean that a climate change event will happen in these cities; rather, these results suggest that if any of them experience an extreme climate event, they will likely be impacted worse than others. To measure the overall impact of climate change, we incorporated ND-GAIN's probability metric to assess the likelihood of a climate disaster occurring.
Defining Our "High-Impact" Metric
For each extreme climate event, we developed a Climate Change Impact Metric to rank cities (i.e., "highest impact").
We first ranked the 100 most populated cities on the three previously introduced metrics: probability of the extreme event, risk, and readiness.
We then weighted the "probability of the extreme event" .6 and "risk score" and "readiness score" .2 each and added those measures together to calculate our Climate Change Impact Metric.
The probability of the extreme event is weighted more because we wanted to prioritize the possibility of the hazard occurring in a particular location. Vulnerability to and preparedness for disasters are important metrics, but the probability of an extreme event should take precedence when assessing the overall impact of climate change to a particular city.
Higher scores on this metric indicate higher impact (e.g., a score of 100 would mean the highest ranking on probability, the highest ranking on risk, the lowest raking on readiness).
Here are the results, where a higher score indicates the greater impact of a particular hazardous weather event on a city.
To provide the full picture, for each hazard we looked at the five cities that will be most impacted, the cities that have the highest probability of having that specific disaster in 2040, and the cities that are at the highest risk.
Because readiness scores do not change based on the climate event, we do not provide further rankings on them (e.g., Madison, WI; Seattle, WA; Plano, TX; Minneapolis, MN; and Raleigh, NC always rank the top 5) .
Heat
The probability of a heat event in 2040 is defined as the annual probability of six consecutive days in which the temperature of each day falls above the 90th percentile of a city’s baseline period between 1950-1999.
Highest impact:
- Hialeah, FL
- Detroit, MI
- Miami, FL
- Cleveland, OH
- Toledo, OH
Highest probability:
- Indianapolis, IN
- Toledo, OH
- Detroit1, MI
- Cincinnati1, OH
- St. Petersburg2, FL
- Memphis2, TN
Highest risk:
- Santa Ana, CA
- Newark, NJ
- Hialeah, FL
- Miami, FL
- Chicago, IL
1 These cities both ranked third.
2 These cities both ranked fifth.
The number of record high temperature events in the U.S. has been increasing as average global temperatures rise. Heat waves cause more fatalities than other natural disasters such as floods, lightning, tornadoes, and hurricanes.
Heat waves are a major consequence of climate change, and we found that cities concentrated in the Midwest and South will be most affected. Heat-related disasters are more likely to occur in these areas due to a combination of higher risk and lower readiness.
For heat hazards, the risk scores were negatively correlated with readiness scores, meaning higher risk cities are also less prepared for heat waves (-0.29).
Why do heat waves hit the Midwest and the Southeast harder than other regions across the U.S.? Simple: humidity.
As humidity increases, our ability to cool ourselves by sweating diminishes. According to the Midwestern Regional Climate Center, the Midwest's hot weather is typically accompanied by high humidity, resulting in a population that's more vulnerable to the rising temperatures. It typically takes a few days of oppressive heat and humidity before a population becomes affected, but climate change will lead to more consecutively hot days that negatively impact Midwestern populations. Older populations are at greater risk: Conditions that cause heat cramps in a 17-year-old may result in heat exhaustion in someone 40 years old.
Flood
The probability of a flood event in 2040 is defined as the annual probability of 5-consecutive days in which precipitation exceeds a city’s baseline period between 1950-1999.
Highest impact:
- St. Petersburg, FL
- Modesto, CA
- Corpus Christi, TX
- Sacramento, CA
- Stockton, CA
Highest probability:
- St. Petersburg, FL
- Modesto3, CA
- San Jose3, CA
- Orlando3, FL
- Fremont3, CA
Highest risk:
- Hialeah, FL
- Miami, FL
- Irving, TX
- Corpus Christi, TX
- Baton Rouge, LA
3 These cities all ranked second.
The U.S. has also witnessed increasing numbers of intense rainfall events over the last 50 years, with a 20% increase. Floodplains are expected to grow by 40-45% over the next 90 years because of climate change.
We found that flooding will have the highest impact on St. Petersburg, FL; Corpus Christi, TX; Modesto, CA; Sacramento, CA; and Stockton, CA.
Southern cities, such as St. Petersburg, FL and Corpus Christi, TX, are close in proximity to river basins that tend to overflow during above-average rainfall as well as melting snow, leading to increased risk.
Cities in California, on the other hand, are susceptible to floods for multiple reasons. California has many valleys that are highly vulnerable to both overflowing rivers, as well as coastal cities that are exposed to high tides.
The areas that are affected by wildfires and drought are also quite vulnerable to floods because the ground cannot absorb water as efficiently after these incidents.
Much like overall risk and readiness ratings, flooding risk scores were negatively correlated with readiness scores (-0.21).
Drought
The probability of a drought event in 2040 is defined based on precipitation data. Forecasts for lower levels of rainfall are estimated based on the size of the deviation from the historical average.
Highest impact:
- Hialeah, FL
- Chicago, IL
- Richmond, VA
- Riverside, CA
- Norfolk, VA
Highest probability:
- Hialeah4, FL
- Richmond4, VA
- Chicago5, IL
- Spokane5, WA
- Virginia Beach, VA
Highest risk:
- Santa Ana, CA
- Boston, MA
- Jersey City, NJ
- Washington, DC
- Baltimore, MD
4 These cities both ranked first.
5 These cities both ranked third.
Drought is yet another consequence of climate change led by global warming. In 2012, 81% of the U.S. was under abnormally dry conditions and fifteen of the 20 largest fires initiated by prolonged dry seasons in California have occurred since 2000.
Droughts have been a reality for 20 years in the southwestern US and by 2040, they are expected to impact more eastern regions as well.
Based on our Climate Change Impact Metric, Hialeah, FL; Chicago, IL; Richmond, VA; Riverside, CA; and Norfolk, VA will be highly impacted by droughts by 2040.
For droughts, the risk scores were not statistically related to readiness scores (-0.05). This means that cities with a higher risk of drought were not necessarily more likely to be less prepared.
Sea Level Rise
The projected sea level rise from NOAA’s sea level rise viewer in feet based on an intermediate scenario for 2040.
Highest impact:
- Norfolk, VA
- Baton Rouge, LA
- New Orleans, LA
- Newark, NJ
- Corpus Christi, TX
Highest probability: Baton Rouge6, LA, New Orleans6 , LA, Houston, TX, Norfolk7, VA, Chesapeake7, VA.
Highest risk: Jacksonville, FL, Hialeah, FL, Newark, NJ, Chesapeake, VA, Norfolk, VA.
6 These cities both ranked first.
7 These cities both ranked fourth.
Another adverse effect of global warming is sea level rise. The rate of sea level rise in the last two decades is nearly double that of the last century, with 2014 having the highest global annual average of 2.6 inches above the 1993 average.
In the US, 40% of the population lives in highly populated coastal areas.
Among these areas, Norfolk, VA; Baton Rouge, LA; New Orleans, LA; Newark, NJ; and Corpus Christi, TX will likely be the most affected by sea level rise.
Houston, TX did not make the list because it has a low risk score and a relatively high readiness score, whereas Chesapeake, VA has a relatively high readiness score.
For sea level rise, the risk scores were not statistically related to readiness scores (-.11).
Cold
The probability of a cold event in 2040 is defined as the annual probability of six consecutive days in which the temperature falls below the 10th percentile of a city’s baseline period between 1950-1999.
Highest impact:
- Fresno, CA
- Laredo, TX
- Lubbock, TX
- Stockton, CA
- El Paso, TX
Highest probability:
- Lubbock8, TX
- Albuquerque8, NM
- Portland9, OR
- Lincoln9, NE
- El Paso10, TX
- Denver10, CO
- Aurora10, CO
Highest risk:
- Santa Ana, CA
- Miami, FL
- Hialeah, FL
- Newark, NJ
- Philadelphia, PA
8 These cities both ranked first.
9 These cities both ranked third.
10 These cities all ranked fifth.
The number of low temperature days has been decreasing in the U.S. since 1950. Nonetheless, since 1990 harsher winters have been observed in the U.S., a trend that is potentially linked to global warming.
Extreme colds (relative to a particular city’s historical average) can disturb economic activities such as farming or fishing and affect vulnerable populations such as the elderly and children.
Based on our Climate Change Impact Metric, Fresno, CA; Laredo, CA; Stockton, CA; Lubbock, TX; and El Paso, TX rank as the top 5 cities that will be influenced by an extreme cold event (relative to their historical average).
Interestingly, many of these cities are in warm areas like southern Texas.
At first blush, these aren't the cities we typically associate with extreme cold. However, given the increased probability of extreme cold, combined with these cities lack of infrastructure built around cold weather (e.g. snowplows, central heating, etc.), they are much more vulnerable to cold weather events.
Furthermore, economic activities in these cities will be impacted more, with Texas already showing the largest crop-yield decrease, 20%, in the U.S. since Arctic warming.
» Learn more about the current state of Texas' residential real estate market
Although cities such as Portland, OR; Lincoln, NE; and Denver, CO also have higher probabilities of an extreme cold event, these cities are not as vulnerable to such an event (i.e., lower risk scores).
For the cold hazard, we also found a significant negative correlation of -0.28 between risk and readiness scores, meaning that the most vulnerable cities are less ready for such an event.
Conclusion
Some U.S. cities, such as Madison, WI and Seattle, WA, will be less impacted by extreme climate events because their population is less vulnerable and they have a higher capacity to adapt to climate change.
Other cities, such as Hialeah, FL; Corpus Christi, TX; and Newark, NJ consistently ranked in the top 5 cities to be impacted by at least two of the listed extreme climate events. Residents of such cities, as well as people who are planning to move to these areas, should start considering these factors now.
Echoing the report of ND-GAIN, these results are not intended to herald the coming apocalypse, but rather to uncover hidden vulnerabilities and encourage a collective proactive response.
While we cannot stop climate change, we can adapt to it by taking precautionary measures and educating the general public about the coming risks.
For questions about this study or the methodology, reach out to Thomas O'Shaughnessy (thomas@movewithclever.com) and Eylul Tekin (eylul@movewithclever.com).
Full Terminology (taken from ND-GAIN’s website)
Risk
A city’s vulnerability to climate change. Risk incorporates exposure, sensitivity and adaptive capacity:
Exposure relates to physical exposure, which means the number of individuals and critical infrastructure exposed to a climate hazard event. Exposure has a geographic and temporal character.
For extreme cold, heat, flooding, drought and sea-level rise, sensitivity refers to the degree to which population of the city is affected by climate hazards. Adaptive capacity refers to the city’s ability to respond to the consequences of climate hazards.
By way of example, drought sensitivity refers to the degree to which economic sectors rely on water-intensive industries (agriculture, water transportation, mining, utilities) and adaptive capacity reflect the ability of the city to manage drought through the management plans, or early warning systems.
Readiness
The capacity of urban society has to mobilize adaptation investments from private sectors and to target investments more effectively. Readiness is a function of economic, governance, and social readiness:
Economic Readiness: The economic condition to support adaptation and to attract adaptation investment.
Governance Readiness: The governance support that enables effective use of adaptation investment.
Social Readiness: The social capacity that facilitates the uptake of the benefits brought about through adaptation investment.
For the technical report and full methodology of ND-GAIN: https://gain.nd.edu/assets/293226/uaa_technical_document.pdf