
Wilmington is home to the best residential real estate investment market in Delaware.
The 19801 zip code in Wilmington presents the greatest opportunity for the best real estate investments among the 384 individual real estate markets in Delaware we evaluated. We looked at property values, population trends, and six other metrics for each market. We used that data to calculate each market's InvestScore.
💰 Looking to invest in real estate? Find a top local realtor with experience helping real estate investors find great deals.
Clever has earned home buyers’ and home sellers' trust with more than 3,800 5-star customer ratings on Trustpilot.
Our team is committed to making home selling more transparent by educating sellers through guides like this one. Our writers, editors, and industry-leading researchers strive to provide its readers with the most up-to-date, accurate, and useful information.
Our research has been featured in The New York Times, Business Insider, Inman, Housing Wire, and many more publications.
Data sources
Most of the data in this article comes from the Zillow Home Value Index and the U.S. Census American Community Survey.
We update our data when the original sources update their data, usually monthly. Sometimes we'll update data more frequently.
Clever also performs regular quality checks to identify outdated data, broken data connections, and other data issues that may arise.
About Clever Real Estate
Clever Real Estate has matched more than 200,000 buyers and sellers with agents.
We partner with over 18,000 top-performing agents nationwide at national brokers including Keller Williams, RE/MAX, Century 21, and more. Our free agent-matching tool connects sellers with agents who have agreed to work for a 1.5% commission rate, while Clever Offers lets sellers compare cash offers on their home at no charge.
5 best places to invest in Delaware
| Rank | City | InvestScore | Affordability | Property value appreciation |
|---|---|---|---|---|
| 1 | Wilmington | 100 | 3.4 | 44.94% |
| 2 | Felton | 90.3 | 4.5 | 32.87% |
| 3 | Camden | 81.6 | 4.4 | 30.02% |
| 4 | Hartly | 79.5 | 4.6 | 28.14% |
| 5 | Newark | 78.5 | 4.2 | 29.18% |
🚨 This article is for informational purposes only. It isn't intended to convey financial or legal advice. We recommend you talk to a real estate agent or real estate attorney when buying a home in Delaware.
1. Wilmington
We've identified the 19801 zip code in Wilmington as Delaware's best real estate investment market. Here's why.
🔎 Key data about Wilmington (19801)
| Data point | Value | Rank in state (of 384 markets) |
|---|---|---|
| InvestScore | 100 | Highest |
| Typical property value | $179,869[1] | lowest |
| Five-year appreciation | 44.94%[2] | highest |
| Household income | $52,810[3] | 45th highest |
| Affordability ratio | 3.4 | most affordable |
| Five-year population growth | 0.97%[4] | 28th highest |
| Unemployment rate | 4.40%[5] | 2nd lowest |
| Property taxes | $1,722[6] | 31st lowest |
| Educational attainment | 29.30%[7] | 22nd highest |
Wilmington (zip code 19801) is the best residential real estate investment market in Delaware. It has the highest property value appreciation among markets we evaluated, with a 44.94% appreciation of the typical property over the last five years.
Wilmington is the most affordable market among the 384 Delaware markets we evaluated, with an affordability ratio of 3.4.
2. Felton
The 19952 zip code in Felton is the runner-up spot for the best real estate investments in Delaware.
🔎 Key data about Felton (19952)
| Data point | Value | Rank in state (of 384 markets) |
|---|---|---|
| InvestScore | 90.3 | 2nd highest |
| Typical property value | $347,302[1] | 14th lowest |
| Five-year appreciation | 32.87%[2] | 2nd highest |
| Household income | $76,791[3] | 29th highest |
| Affordability ratio | 4.5 | 22nd most affordable |
| Five-year population growth | 1.66%[4] | 24th highest |
| Unemployment rate | 5.50%[5] | 3rd lowest |
| Property taxes | $1,079[6] | 6th lowest |
| Educational attainment | 24.80%[7] | 29th highest |
The 19952 zip code in Felton features a typical property value of $347,302, the 14th lowest in the state.
Property values have appreciated 32.87% over the past five years, the 2nd highest increase among evaluated markets in the state. Felton homes have an affordability ratio of 4.5, the 22nd most affordable in the state.
3. Camden
The 19934 zip code in Camden comes in at No. 3 in our ranking of the best residential real estate investment markets in Delaware.
🔎 Key data about Camden (19934)
| Data point | Value | Rank in state (of 384 markets) |
|---|---|---|
| InvestScore | 81.6 | 3rd highest |
| Typical property value | $386,608[1] | 25th lowest |
| Five-year appreciation | 30.02%[2] | 7th highest |
| Household income | $87,125[3] | 21st highest |
| Affordability ratio | 4.4 | 20th most affordable |
| Five-year population growth | 3.55%[4] | 12th highest |
| Unemployment rate | 5.50%[5] | 3rd lowest |
| Property taxes | $1,452[6] | 20th lowest |
| Educational attainment | 36.30%[7] | 17th highest |
With a typical property value of $386,608, Camden's 19934 zip code features the 25th lowest property values in the state.
Camden homes have an affordability ratio of 4.4, the 20th most affordable among the markets we evaluated.
4. Hartly
The 19953 zip code in Hartly ranks No. 4 among Delaware's residential real estate investment markets.
🔎 Key data about Hartly (19953)
| Data point | Value | Rank in state (of 384 markets) |
|---|---|---|
| InvestScore | 79.5 | 4th highest |
| Typical property value | $376,177[1] | 23rd lowest |
| Five-year appreciation | 28.14%[2] | 14th highest |
| Household income | $81,792[3] | 14th highest |
| Affordability ratio | 4.6 | 23rd most affordable |
| Five-year population growth | 13.89%[4] | highest |
| Unemployment rate | 5.50%[5] | 3rd lowest |
| Property taxes | $1,103[6] | 8th lowest |
| Educational attainment | 16.10%[7] | 40th highest |
Property values in Hartly's 19953 zip code have seen the 14th highest increase among evaluated markets in the state, with an appreciation of 28.14% over the past five years.
Hartly's affordability ratio of 4.6 makes it the 23rd most affordable among the 384 markets we evaluated.
5. Newark
The 19713 zip code in Newark rounds out our top five residential real estate investment markets in Delaware.
🔎 Key data about Newark (19713)
| Data point | Value | Rank in state (of 384 markets) |
|---|---|---|
| InvestScore | 78.5 | 5th highest |
| Typical property value | $318,502[1] | 8th lowest |
| Five-year appreciation | 29.18%[2] | 9th highest |
| Household income | $76,493[3] | 9th highest |
| Affordability ratio | 4.2 | 16th most affordable |
| Five-year population growth | 0.65%[4] | 31st highest |
| Unemployment rate | 4.40%[5] | 2nd lowest |
| Property taxes | $1,965[6] | 33rd lowest |
| Educational attainment | 31.10%[7] | 21st highest |
Property values in Newark's 19713 zip code rose 29.18% over the last five years, ranking the city 9th highest among evaluated markets in Delaware.
Newark homes have an affordability ratio of 4.2, the 16th most affordable among the markets we evaluated.
Buy your investment property with a top local realtor who specializes in helping real estate investors find great deals. Clever can connect you with investing pros at trusted brands like Keller Williams and RE/MAX.
Enter your zip code to get personalized agent matches sent straight to your inbox. Compare your options until you find the perfect fit, or walk away with no obligation. Try Clever's free service today!
Frequently asked questions
See our article Steps to Buying Your First Rental Property to learn the basics of real estate investing for beginners.
You'll learn the importance of setting goals, picking the right market, and more.
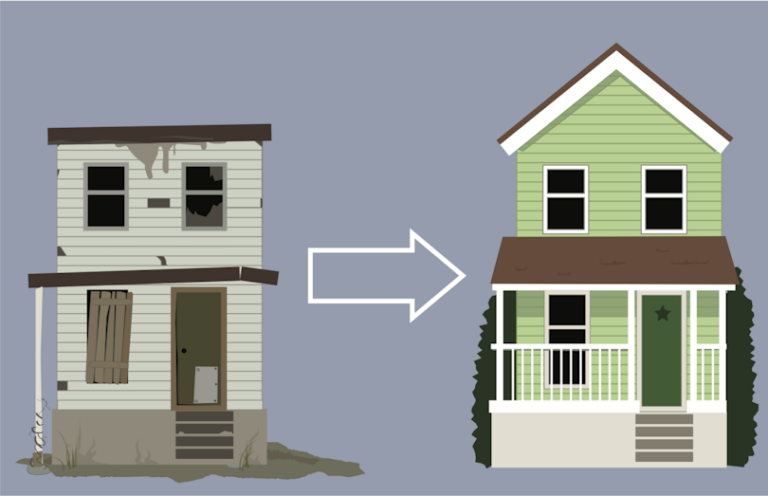
Cash investors often use what's called the 70% rule, which suggests they should pay around 70% of a house's after-repair value minus the cost of renovations.
By buying for about 70% of the after-repair value, they're positioning themselves to pay for repairs and other costs, and to lock in a profit.
The 70% rule isn’t a hard-and-fast formula, but a quick guideline investors use to evaluate potential deals.
Investing in residential real estate can be one of the best passive real estate investments in Delaware.
Residential real estate offers accessible passive income and the potential to compound your original investment.
Renting out residential units is the top way to invest in real estate. House hacking also offers a great opportunity for passive real estate investment income.
How we rank residential real estate markets in Delaware
To determine the best real estate investments in Delaware we evaluated 384 markets on eight metrics, and then assigned an InvestScore based on a proprietary weighting framework. Each market corresponds to a specific zip code in Delaware.
What is InvestScore?
InvestScore is a score on a scale of 0 (worst in state) to 100 (best in state) that estimates the residential real estate investment potential of a given market. It takes into account a suite of key data points for each city.
- Typical property value: This measures the typical home value in this zip code, according to the Zillow Home Value Index. It reflects the typical value for homes in the 35th to 65th percentile range, including all homes, with the numbers smoothed and seasonally adjusted. We prefer lower property values, which indicate both more room for growth and a greater ease of purchase.
- Property value appreciation: This measures how much property values have increased in the area over the past five years, according to the Zillow Home Value Index. We prefer a higher appreciation, as it indicates better returns on housing. However, past performance isn't indicative of future results.
- Median household income: This is the inflation-adjusted median household income in the zip code, according to U.S. Census American Community Survey data. We prefer a higher household income, as it indicates local residents have more income to spend on housing.
- Affordability ratio: This is the ratio of the typical home value to the median household income in the area. A lower ratio is better because it means more households can afford a home, which indicates higher demand.
- Population growth: This is how much the area's population has grown over the past five years, according to U.S. Census estimates. Higher is better, as it indicates residents are moving into the area at a rapid clip.
- Unemployment rate: This is the unemployment rate in the area, according to U.S. Census data. We prefer a lower rate, as it indicates the availability of steady employment in the area, meaning residents will find it much easier to afford homes.
- Property tax: This is the median real estate property tax paid in the area, according to U.S. Census estimates.
- Educational attainment: This is the percentage of residents in the area that have obtained a bachelor's degree or better, according to U.S. Census estimates. We prefer a higher rate because it indicates local residents who have higher earning potential and thus should be able to afford homes.