
The 15801 zip code in DuBois, Pennsylvania tops our ranking of the most affordable places to live in the Northeast.
Whether you're searching for affordable cities and towns to buy a home or the places with the lowest cost of living to rent, consider the following zip codes.
🏠 Want to buy in DuBois or another affordable city in the Northeast? Connect with a local agent who knows the market.
Top 10 most affordable places to live in the Northeast
The Northeast includes Connecticut, Maine, Massachusetts, New Hampshire, New Jersey, New York, Rhode Island, Pennsylvania, and Vermont.
| Rank | City | Affordability Score | Median home value | Rental costs |
|---|---|---|---|---|
| 1 | DuBois, PA 🥇 | 97.1 | $171,295 | $1,007 |
| 2 | New Brighton, PA🥈 | 94.5 | $150,709 | $1,023 |
| 3 | Altoona, PA 🥉 | 93.9 | $130,641 | $979 |
| 4 | Clairton, PA | 93.2 | $159,586 | $1,235 |
| 5 | Uniontown, PA | 92.9 | $155,312 | $931 |
| 6 | Jeannette, PA | 92.2 | $172,953 | $1,052 |
| 7 | Windber, PA | 91.6 | $111,219 | $1,606 |
| 8 | Pittsburgh, PA | 91.4 | $214,413 | $1,324 |
| 9 | Bradford, PA | 91.2 | $105,207 | $1,606 |
| 10 | Jamestown, NY | 75.1 | $117,867 | $920 |
What these affordable cities and towns have in common
The 10 zip codes we ranked share a common trait: a low cost of living relative to the regional median.
Median home values, rental costs, and property taxes generally sit below the regional averages, while household incomes remain strong enough to keep home affordability ratios manageable. Below, we look at each market in detail.
✍️ Editor's note: The cities below represent multiple states, which means the affordability picture extends beyond what any single ranking can capture. State income taxes, sales taxes, climate, and job market strength vary significantly across the region.
These factors can shift the real cost of living by thousands of dollars per year. Use these rankings to narrow your search, then dig into the state-specific factors that matter most to you.
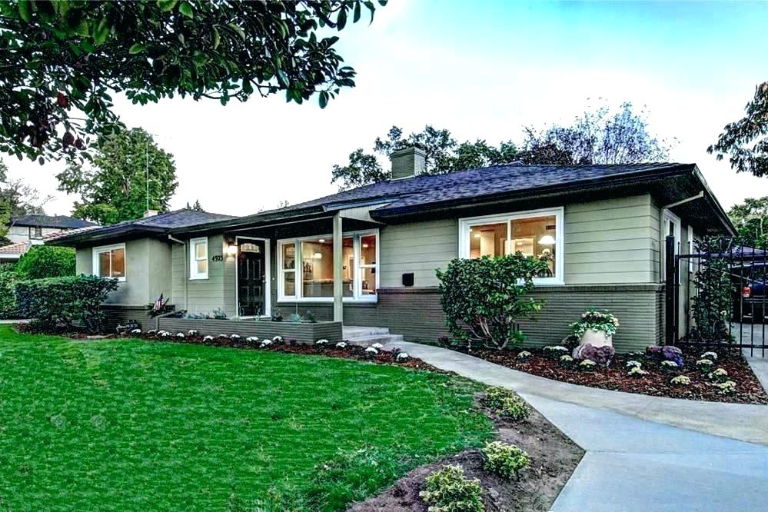
1. DuBois, Pennsylvania
Here's why the 15801 zip code in DuBois is the region's most affordable place to live.
🔎 Key data about DuBois
| Data point | Value | Rank (out of 1,662 markets) | Difference from median or average |
|---|---|---|---|
| Affordability Score | 97.1 | No. 1 | N/A |
| Median home value | $171,295[1] | No. 66 | -$351,728 |
| Home affordability ratio | 2.5 | No. 34 | -2.9 |
| Home value five-year change | 16.0%[2] | No. 57 | -20.3% |
| Home value one-year forecast | -3.5%[3] | No. 5 | -4.6% |
| Rental costs | $1,007[4] | No. 15 | -$1,233 |
| Rent affordability ratio | 1.49% | No. 35 | -0.9% |
| Median household income | $67,583[5] | No. 280 | -$27,724 |
| Property taxes | $2,051[6] | No. 70 | -$3,982 |
| Energy costs | $0.13 kWh[7] | No. 249 | -$0.06 |
DuBois's 15801 zip code is the cheapest place to live in the Northeast, leading the 1,662 markets we evaluated.
The median home value is $171,295, making it the 66th-cheapest housing market in the region. Forecasts project a -3.5% change in home values in the next year. Rent in the zip code averages $1,007 per month, which is the 35th-cheapest amount in the Northeast.
The median property tax for homeowners in DuBois is $2,051 per household, the No. 70 ranked market in the Northeast.
Residents pay $0.13 per kWh of electricity, which ranks No. 249 among the region's markets.
2. New Brighton, Pennsylvania
The 15066 zip code is the 2nd-cheapest place to live in the Northeast.
🔎 Key data about New Brighton
| Data point | Value | Rank (out of 1,662 markets) | Difference from median or average |
|---|---|---|---|
| Affordability Score | 94.5 | No. 2 | N/A |
| Median home value | $150,709[1] | No. 39 | -$372,315 |
| Home affordability ratio | 2.4 | No. 24 | -3.1 |
| Home value five-year change | 11.2%[2] | No. 35 | -25.0% |
| Home value one-year forecast | -1.3%[3] | No. 39 | -2.4% |
| Rental costs | $1,023[4] | No. 17 | -$1,217 |
| Rent affordability ratio | 1.60% | No. 59 | -0.7% |
| Median household income | $63,836[5] | No. 303 | -$31,471 |
| Property taxes | $2,262[6] | No. 82 | -$3,771 |
| Energy costs | $0.17 kWh[7] | No. 336 | -$0.03 |
New Brighton's 15066 zip code has a median home value of $150,709, which is the 39th-cheapest housing market in the Northeast. You can rent for an average of $1,023 per month. That's the 17th-cheapest price in the region.
The average household income in the zip code is $63,836, which ranks 303rd-highest in the Northeast.
Homeowners in New Brighton pay a median property tax of $2,262 per year, making it the 82nd-most affordable market in the region.
New Brighton ranks No. 336 among the region's energy markets. You'll pay $0.17 per kWh of electricity.
3. Altoona, Pennsylvania
The 3rd-least-expensive place to live in the Northeast is Altoona's 16602 zip code.
🔎 Key data about Altoona
| Data point | Value | Rank (out of 1,662 markets) | Difference from median or average |
|---|---|---|---|
| Affordability Score | 93.9 | No. 3 | N/A |
| Median home value | $130,641[1] | No. 21 | -$392,382 |
| Home affordability ratio | 2.4 | No. 25 | -3.1 |
| Home value five-year change | 16.0%[2] | No. 59 | -20.3% |
| Home value one-year forecast | -1.3%[3] | No. 39 | -2.4% |
| Rental costs | $979[4] | No. 11 | -$1,261 |
| Rent affordability ratio | 1.78% | No. 104 | -0.6% |
| Median household income | $55,046[5] | No. 357 | -$40,261 |
| Property taxes | $1,393[6] | No. 17 | -$4,640 |
| Energy costs | $0.15 kWh[7] | No. 326 | -$0.05 |
The No. 21 cheapest housing market in the Northeast is Altoona's 16602 zip code, with a median home value of $130,641. Rents in the market average $979 per month, making it the 11th-most affordable rental market in the region.
The median property tax for households in Altoona is $1,393, which makes it the 17th-cheapest place in the Northeast. Altoona ranks No. 326 among the region's markets by energy costs. Residents pay $0.15 per kWh of electricity.
4. Clairton, Pennsylvania
The 15025 zip code in Clairton comes in at No. 4 on our list of the cheapest places to live in the Northeast.
🔎 Key data about Clairton
| Data point | Value | Rank (out of 1,662 markets) | Difference from median or average |
|---|---|---|---|
| Affordability Score | 93.2 | No. 4 | N/A |
| Median home value | $159,586[1] | No. 49 | -$363,437 |
| Home affordability ratio | 2.1 | No. 10 | -3.4 |
| Home value five-year change | 13.4%[2] | No. 45 | -22.8% |
| Home value one-year forecast | -1.5%[3] | No. 17 | -2.6% |
| Rental costs | $1,235[4] | No. 50 | -$1,005 |
| Rent affordability ratio | 1.61% | No. 62 | -0.7% |
| Median household income | $76,531[5] | No. 212 | -$18,776 |
| Property taxes | $3,331[6] | No. 190 | -$2,702 |
| Energy costs | $0.17 kWh[7] | No. 336 | -$0.03 |
The No. 49 cheapest housing market in the Northeast is Clairton's 15025 zip code, where the median home value is $159,586. Renters here pay an average of $1,235 per month.
When it comes to energy costs, Clairton ranks 336th among the region's markets. Residents pay $0.17 per kWh of electricity.
The median property tax for households in the zip code is $3,331, which makes it the 190th-cheapest market in the Northeast.
5. Uniontown, Pennsylvania
The 15401 zip code in Uniontown ranks No. 5 among the region's most affordable places to live.
🔎 Key data about Uniontown
| Data point | Value | Rank (out of 1,662 markets) | Difference from median or average |
|---|---|---|---|
| Affordability Score | 92.9 | No. 5 | N/A |
| Median home value | $155,312[1] | No. 48 | -$367,711 |
| Home affordability ratio | 2.9 | No. 82 | -2.6 |
| Home value five-year change | 11.8%[2] | No. 39 | -24.4% |
| Home value one-year forecast | -1.2%[3] | No. 60 | -2.3% |
| Rental costs | $931[4] | No. 7 | -$1,309 |
| Rent affordability ratio | 1.73% | No. 89 | -0.6% |
| Median household income | $53,925[5] | No. 363 | -$41,382 |
| Property taxes | $1,699[6] | No. 39 | -$4,334 |
| Energy costs | $0.13 kWh[7] | No. 249 | -$0.06 |
Uniontown's 15401 zip code has a median home value of $155,312, the 48th-cheapest housing market in the region. Forecasts project a -1.2% change in home values in the next year.
The median property tax per household in Uniontown is $1,699. It's the 39th-cheapest market by tax rate in the Northeast.
6. Jeannette, Pennsylvania
The No. 6 most affordable city to live in the Northeast is the 15644 zip code in Jeannette.
🔎 Key data about Jeannette
| Data point | Value | Rank (out of 1,662 markets) | Difference from median or average |
|---|---|---|---|
| Affordability Score | 92.2 | No. 6 | N/A |
| Median home value | $172,953[1] | No. 71 | -$350,070 |
| Home affordability ratio | 2.7 | No. 48 | -2.8 |
| Home value five-year change | 23.7%[2] | No. 111 | -12.5% |
| Home value one-year forecast | -1.2%[3] | No. 60 | -2.3% |
| Rental costs | $1,052[4] | No. 21 | -$1,188 |
| Rent affordability ratio | 1.63% | No. 65 | -0.7% |
| Median household income | $64,684[5] | No. 300 | -$30,623 |
| Property taxes | $2,047[6] | No. 69 | -$3,986 |
| Energy costs | $0.13 kWh[7] | No. 249 | -$0.06 |
The back half of our top 10 kicks off with Jeannette's 15644 zip code, which has the 71st-cheapest home values in the Northeast. The median home value is $172,953. Rents average $1,052 per month, making it the 21st-most affordable rental market in the region.
Residents pay $0.13 per kWh of electricity. It's the 249th-cheapest energy market.
7. Windber, Pennsylvania
Windber's 15963 zip code is the 7th-cheapest place to live in the Northeast.
🔎 Key data about Windber
| Data point | Value | Rank (out of 1,662 markets) | Difference from median or average |
|---|---|---|---|
| Affordability Score | 91.6 | No. 7 | N/A |
| Median home value | $111,219[1] | No. 10 | -$411,805 |
| Home affordability ratio | 1.8 | No. 6 | -3.7 |
| Home value five-year change | 9.1%[2] | No. 27 | -27.2% |
| Home value one-year forecast | -2.3%[3] | No. 8 | -3.4% |
| Rental costs | $1,606[4] | No. 146 | -$634 |
| Rent affordability ratio | 1.90% | No. 134 | -0.5% |
| Median household income | $61,566[5] | No. 315 | -$33,741 |
| Property taxes | $1,399[6] | No. 18 | -$4,634 |
| Energy costs | $0.14 kWh[7] | No. 303 | -$0.05 |
You'll find the 10th-cheapest home values in the Northeast in Windber's 15963 zip code. The median value: $111,219. Renters in Windber pay an average of $1,606 per month.
Homeowners in Windber pay a median property tax of $1,399 per year, which is the region's 18th-most affordable market.
The average household income is $61,566, which ranks 315th-highest in the Northeast.
8. Pittsburgh, Pennsylvania
The 8th-least-expensive place to live in the Northeast is Pittsburgh's 15216 zip code.
🔎 Key data about Pittsburgh
| Data point | Value | Rank (out of 1,662 markets) | Difference from median or average |
|---|---|---|---|
| Affordability Score | 91.4 | No. 8 | N/A |
| Median home value | $214,413[1] | No. 120 | -$308,610 |
| Home affordability ratio | 2.7 | No. 45 | -2.8 |
| Home value five-year change | 9.9%[2] | No. 30 | -26.4% |
| Home value one-year forecast | -1.4%[3] | No. 25 | -2.5% |
| Rental costs | $1,324[4] | No. 73 | -$916 |
| Rent affordability ratio | 1.65% | No. 74 | -0.7% |
| Median household income | $80,313[5] | No. 187 | -$14,994 |
| Property taxes | $2,720[6] | No. 132 | -$3,313 |
| Energy costs | $0.17 kWh[7] | No. 336 | -$0.03 |
The 120th-cheapest housing market in the Northeast is Pittsburgh's 15216 zip code, with a median home value of $214,413. Renters pay an average of $1,324 per month, the No. 73 rental market in the region.
The median property tax for households in Pittsburgh is $2,720, which makes it the 132nd-cheapest place in the Northeast. The average household income of $80,313 ranks 187th.
9. Bradford, Pennsylvania
Bradford's 16701 zip code is one of the region's most affordable towns, sneaking into the top ten of our rankings.
🔎 Key data about Bradford
| Data point | Value | Rank (out of 1,662 markets) | Difference from median or average |
|---|---|---|---|
| Affordability Score | 91.2 | No. 9 | N/A |
| Median home value | $105,207[1] | No. 9 | -$417,816 |
| Home affordability ratio | 1.6 | No. 4 | -3.8 |
| Home value five-year change | 14.4%[2] | No. 49 | -21.9% |
| Home value one-year forecast | -2.4%[3] | No. 6 | -3.5% |
| Rental costs | $1,606[4] | No. 146 | -$634 |
| Rent affordability ratio | 1.90% | No. 134 | -0.5% |
| Median household income | $65,102[5] | No. 298 | -$30,205 |
| Property taxes | $1,899[6] | No. 54 | -$4,134 |
| Energy costs | $0.13 kWh[7] | No. 249 | -$0.06 |
The 9th-cheapest housing market in the Northeast is Bradford's 16701 zip code, where the median home value is $105,207. Renters pay an average of $1,606 per month. It's the region's 146th-cheapest rental market.
The median property tax for households within the zip code is $1,899, which makes it the 54th-cheapest property tax rate in the Northeast.
10. Jamestown, New York
The final spot on our list of the most affordable places to live in the Northeast goes to the 14701 zip code in Jamestown.
🔎 Key data about Jamestown
| Data point | Value | Rank (out of 1,662 markets) | Difference from median or average |
|---|---|---|---|
| Affordability Score | 75.1 | No. 10 | N/A |
| Median home value | $117,867[1] | No. 11 | -$405,157 |
| Home affordability ratio | 2.4 | No. 9 | -3.1 |
| Home value five-year change | 43.7%[2] | No. 392 | 7.4% |
| Home value one-year forecast | 2.1%[3] | No. 389 | 1.0% |
| Rental costs | $920[4] | No. 1 | -$1,320 |
| Rent affordability ratio | 1.85% | No. 40 | -0.5% |
| Median household income | $49,685[5] | No. 456 | -$45,622 |
| Property taxes | $2,716[6] | No. 25 | -$3,317 |
| Energy costs | $0.12 kWh[7] | No. 5 | -$0.08 |
Rounding out our top 10 is Jamestown's 14701 zip code, with the 11th-cheapest home values in the region. The median home value is $117,867. Rent in the market costs $920 per month on average, making it the 1st-most affordable rental market in the Northeast.
The median property tax for households in Jamestown is $2,716, which is the 25th-cheapest property tax rate in the region.
Jamestown ranks No. 5 among Northeast markets by energy costs, with households paying $0.12 per kWh of electricity.
What questions about these cities should I ask local agents?
Once you've found a town you're interested in, you'll want to ask a local agent for details our rankings can't capture. Start with these four questions:
- What neighborhoods inside this zip code have the best resale value?
- What's the rental market like right now?
- Are there local property tax exemptions or homestead programs you'd qualify for?
- What are the most common surprises buyers run into here?
🏡 Need a local agent? We can connect you with an expert who knows the market.
Frequently asked questions about the least expensive places to live in the Northeast
Based on Clever's Affordability Score, the 15801 zip code in DuBois, PA, is the cheapest place to live in the Northeast.
The median home value is $171,295, and the median household income is $67,583, giving DuBois a home affordability ratio of 2.5, meaning a typical home costs about that many times the median annual income.
See our Affordability Score methodology and the full ranking of the 10 cheapest places to live in the Northeast.
The median home value in the Northeast is $523,023.
See the rankings above for how individual cities compare to this region-wide figure.
The median amount homeowners pay in property taxes in the Northeast is $6,033 per year.
Property taxes vary significantly by location, however. The tax figures in the rankings above show how each of the 10 cheapest places stacks up against the regional median.
📍 The 10 cheapest places to live in your state
How we ranked the most affordable cities and towns in the Northeast
We evaluated 1,662 zip codes in the Northeast with a population over 10,000 on nine metrics. We then assigned each market an Affordability Score based on its weighted and combined rankings.
✍️ Editor’s note: Our Affordability Score identifies the most affordable places in a region by zip code.
Often the zip code we identify will represent an entire city or portion of a city.
Occasionally the zip code we identify will encompass an area that includes one or more small towns. In these cases, the data we’ve gathered applies to the entire zip code, not just the single town we’re using to help identify the zip code's location.
If you’re looking to move to one of these affordable places, we recommend doing additional research to make sure the costs in the area — and the quality of life it offers — meet your specific needs.
Methodology: What is an Affordability Score?
Our proprietary Affordability Score is a score on a scale of 0 (worst in region) to 100 (best in region) that estimates the affordability of a particular zip code. It takes into account these key data points for each zip code.
- Median home value: The median home value for each zip code comes from the Zillow Home Value Index. The lower the median home value relative to the median value in the Northeast, the higher our score on this component. We assign a weight of 13.0% to median home value.
- Home affordability ratio. The home affordability ratio is the typical median home value divided by the median household income in the zip code, which reveals the number of years of household income needed to afford a home in that zip code. A lower ratio is better because it means more households can afford a home. The data comes from the Zillow Observed Rent Index and the U.S. Census American Community Survey. We assign a weight of 28.0% to the home affordability ratio.
- Home value five-year change: The home value five-year change is the amount that the median home value in the zip code has risen or fallen during the last five years. Our data comes from the Zillow Home Value Index. We assign a weight of 10.0% to the home value five-year change.
- Home value one-year forecast: The home value one-year forecast comes from Zillow Forecast data. It projects how much home values in the zip code are forecasted to change in the next year. We assign a weight of 8.0% to the home value one-year forecast.
- Rental costs. The rental costs are the observed rents in the zip code, sourced from the Zillow Observed Rent Index. The index includes "listed rents that fall into the 40th to 60th percentile range for all homes and apartments in a given region." We assign a weight of 7.0% to rental costs.
- Median household income: The inflation-adjusted median household income figures for the zip code comes from the U.S. Census American Community Survey. We assign a weight of 5.0% to median household income.
- Rent affordability ratio. The rent affordability ratio is the ratio of rental costs divided by median household income, which provides the percentage of household income needed to pay a typical month’s rent in the zip code. The data comes from the Zillow Observed Rent Index and the U.S. Census American Community Survey. We assign a weight of 17.0% to the rent affordability ratio.
- Property taxes: The property tax figures are the median real estate taxes paid in the zip code, sourced from the U.S. Census American Community Survey. The lower the property tax rate relative to the regional average, the higher our score on this component. We assign a weight of 8.0% to property taxes.
- Energy costs: The energy costs are the costs of a kilowatt hour (kWh) of residential electricity in the zip code, sourced from the U.S. Department of Energy. The lower the cost of electricity relative to the regional average, the higher our score on this component. We assign a weight of 4.0% to energy costs.
Why you should trust us
Clever has earned home buyers’ and home sellers' trust with more than 4,000 5-star customer ratings on Trustpilot.
Our team is committed to making home purchasing more transparent by educating buyers and sellers through guides like this one. Our writers, editors, and industry-leading researchers strive to provide readers with the most up-to-date, accurate, and useful information.
Our research has been featured in The New York Times, Business Insider, Inman, Housing Wire, and many more publications.
About Clever Real Estate
Clever Real Estate has matched more than 227,000 buyers and sellers with agents.
We partner with over 13,000 top-performing agents nationwide at national brokers including Keller Williams, RE/MAX, Century 21, and more. Our free agent-matching tool connects sellers with agents who have agreed to work for a 1.5% commission rate, while Clever Offers lets sellers compare cash offers on their home at no charge.
Related articles