
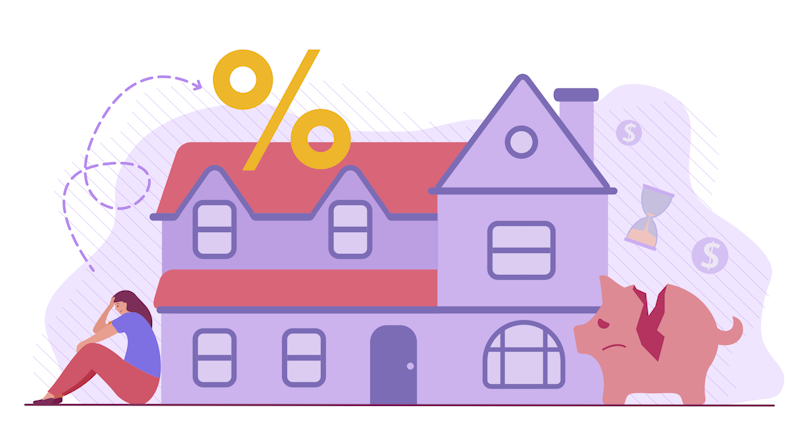
| What is the true cost of owning a home? 💸Outside of a mortgage, the average U.S. homeowner spends $15,405 each year on maintenance, home improvements, and other hidden costs. What's more, one in eight homeowners say the benefits of owning a home aren't worth the hassle. |
The rising rate of buyer's remorse | Unaffordable housing | Is owning a home worth it? | Homeowners' biggest regrets | Spending on maintenance and repairs | The true cost of renovations | Taxes and other hidden costs
For many Americans, homeownership conjures thoughts of comfort and financial security.
But that optimism can evaporate if a first-time home buyer isn't prepared for unexpected costs. Among the 1,000 homeowners we surveyed, 52% admit the true cost of owning a home surprised them.
Not only has the upfront cost of buying a house spiked in the last year amid the COVID-19 pandemic[1] — but our research also shows the average homeowner shells out an additional $15,405 each year on top of their mortgage.
On average, homeowners spend:
- $4,829 on utilities
- $3,300 on home improvements
- $3,018 on maintenance and repairs
- $2,578 on property taxes
- $1,680 on homeowner's insurance
Altogether, these costs have increased by over $2,000 since we last surveyed homeowners in 2019.
Although early stimulus payments padded Americans' savings, homeowners have faced rising expenses as the pandemic continues to wreak havoc on the economy. Two years after the first shutdowns, labor and supply chain shortages are still fueling higher prices for repairs and home improvements.[2] In addition, utility bills have climbed as Americans spend more time at home.[3]
The result is a grim financial landscape for homeowners: Only 55% of homeowners live in what U.S. housing officials consider "affordable housing" (spending 30% or less of household income). In fact, the share of homeowners spending over 40% of their household income on their living space has nearly doubled since 2019 — from 16% to 29% in 2022.
Higher costs could be behind a sharp surge in buyer's remorse. We found that 60% of homeowners said they've felt some form of buyer's remorse — up from 35% in 2019.
To learn more about the true cost of owning a home in 2022, we surveyed 1,000 homeowners about their expectations, expenses, and the effort it takes to maintain their homes in an increasingly unaffordable environment.
True Cost of Homeownership Statistics🏠
|
Most Homeowners (52%) Are Surprised by the True Cost of Homeownership — Especially Millennials
The real cost of homeownership comes as a surprise to the majority of homeowners (52%).
In particular, the true cost of homeownership is nearly twice as likely to catch millennials off guard than baby boomers (60% vs. 32%).
We found that pessimism has become more pervasive since the pandemic began. A growing portion of homeowners feel stressed or anxious about owning a house — 31% in 2022, up from just 24% in 2019.
Most homeowners (53%) admit they would have approached buying differently if they realized the actual cost of homeownership. Out of that group:
- 42% would have negotiated a better price or contingencies
- 29% would have waited to buy a home
- 29% would have purchased a less expensive home
60% of Homeowners Feel Some Form of Buyer's Remorse
Though Americans tend to consider homeownership a financial and personal milestone, many are troubled by lingering thoughts of buyer's remorse.
A majority of homeowners (60%) say they've felt buyer's remorse at some point:
- 25% often feel home buyer's remorse
- 20% sometimes feel home buyer's remorse
- 16% rarely feel home buyer's remorse
- 40% never feel buyer's remorse
Regrets are especially common among those who purchased a home during the pandemic (2020 or later), when sale prices began to boom.[1] Nearly two in five (39%) pandemic-era buyers often feel remorse.
It's important that first-time homeowners recognize the actual cost of buying a house isn't limited to a mortgage: Upkeep demands dollars and time. Of the 60% who feel some form of buyer's remorse, 39% regret how much maintenance their home requires.
Buyer's Remorse Has Skyrocketed During the Pandemic
Rates of home buyer's remorse have increased significantly since 2019, even among those who bought a home pre-pandemic.
Before the pandemic, 20% of homeowners said they sometimes or often felt buyer's remorse. In 2022, that number is up to 45%.
That includes 25% of homeowners who often feel buyer's remorse — a whopping five times the 5% who said the same in 2019.
Meanwhile, the number of homeowners who say they never or rarely feel buyer's remorse has dropped from 81% in 2019 to 56% today.
Nearly 1 in 3 Homeowners Spend More Than 40% of Their Income on Housing
Between mortgage payments and hidden costs, many Americans are spending large portions of their household income on the total cost of homeownership.
U.S. housing officials have long defined "affordable housing" as that which costs occupants less than 30% of their gross household income.[4] Homeownership costs, however, drain at least this
30% threshold for nearly half of homeowners (45%) we surveyed:
- 32% of homeowners spend 20% or less of their income on housing
- 23% of homeowners spend 21% to 30% of their income on housing
- 16% of homeowners spend 31% to 40% of their income on housing
- 29% of homeowners spend 41% or more of their income on housing
In fact, the share of homeowners who spend over 40% of their income on housing has almost doubled since the start of the pandemic — from 16% in 2019 to 29% today.
Nearly Three-Quarters of Homeowners Regret Some Aspect of Their Home Purchase
It's vanishingly rare for buyers to score their "dream house" — especially in today's ultra-competitive market. In fact, 72% of homeowners we surveyed are unhappy with at least one aspect of their living space.
Among homeowners with regrets, the most common are:
- House requires too much maintenance (40%)
- House is too small or lacks desired features (32%)
- Hidden costs (30%)
- Expensive monthly mortgage payments (28%)
- High interest rates (26%)
- Bad location (25%)
- Depreciated home value (24%)
- Made a poorly informed buying decision (23%)
1 in 8 Homeowners Say the Benefits of Homeownership Aren't Worth the Hassle
For the vast majority of homeowners (75%), homeownership is a hassle. Overall, one in eight (12%) say the benefits of owning their house simply aren't worth the inconvenience.
Given those frustrations and a fierce seller's market, some homeowners might be ready to cash-out.
Considering the downsides of owning a home, we asked buyers why they took the plunge in the first place. More than half (52%) said they bought because doing so was a good investment.
The top reasons for buying a house include:
- Homeownership is a good investment (52%)
- Needed or wanted more space (42%)
- Wanted to stop "throwing money away" on rent (37%)
- Moved to a better neighborhood/location (36%)
- Started a family (27%)
- Ability to make renovations and upgrades (22%)
- Bought before the market became more competitive (21%)
- Tax benefits (19%)
- Working from home (14%)
These results demonstrate how the pandemic may have provided an extra push for some to explore the market. About one in five (21%) said they wanted to buy before the competition for houses got even tougher. One in seven (14%) said being able to work from home was a factor.
Homeowners Devote Nearly 230 Hours to Upkeep Annually — in Part Due to Pandemic Lockdowns
Homeowners' maintenance and improvement tasks add up quickly.
Our survey revealed the average homeowner spends about 19 hours a month — almost 230 hours a year — taking care of their house.
This time commitment varies significantly depending on the individual owner. At the high end of the spectrum, 21% of homeowners spend at least 31 hours each month — nearly an entire workweek.
That's a substantial increase from 2019, when only 3% of homeowners spent 31 hours or more on their houses each month.
Nearly all homeowners (89%) are spending at least five hours on maintenance and improvements each month.
The pandemic is prompting a growing number of homeowners to tackle home improvement projects, according to a 2021 study.[5] With fewer homes on the market, many homeowners are prioritizing the living space they already own, rather than searching for a new home altogether.
Americans who bought a home in 2021 or 2022 are spending even more time on repairs, maintenance, and improvements — to the tune of 23 hours each month. That's 21% higher than the overall average.
This could be due to a competitive housing market driving many homeowners to make compromises while house hunting. When we surveyed prospective buyers in 2021, 72% were willing to bet on fixer-uppers.
Despite these riskier purchases, the National Association of Realtors found in a late 2021 survey that nearly one in five buyers (19%) waived a home inspection contingency.[6] Buyers' desperation to reach the closing table may prompt them to make these concessions — but can lead to unpleasant surprises after the keys are handed over.
One-Third of Homeowners Spent at Least $5,000 in Maintenance and Repair Costs in 2021
Maintenance and repairs run homeowners $3,018 a year on average, according to a 2021 survey.[7] (That doesn't include unexpected emergencies that can pile on more costs.)
According to our data, the share of homeowners spending at least $10,000 on maintenance and repairs each year tripled from 6% in 2019 to 20% in 2022. One in three homeowners (33%) spend $5,000 or more annually.
Overall, 94% of homeowners devoted some amount of money to home repairs:
- 13% of homeowners spent $1-$499.
- 15% of homeowners spent $500-$999.
- 17% of homeowners spent $1,000-$2,499.
- 16% of homeowners spent $2,500-$4,999.
- 13% of homeowners spent $5,000-$9,999.
- 13% of homeowners spent $10,000-$19,999.
- 7% of homeowners spent more than $20,000.
High costs were especially common among young owners, with millennials almost 3x as likely to spend at least $5,000 in maintenance and repairs compared to baby boomers (42% vs. 15%).
Painting is the Most Common Home Repair, Followed by Major Appliance Work and Plumbing
Home maintenance and repairs are practically unavoidable — 97% of homeowners have taken on upkeep projects.
Nearly half of homeowners have repainted (49%), with other common fixes including:
- Painting and/or staining (49%)
- Major appliance repair (46%)
- Plumbing (46%)
- Electrical (41%)
- Water heater (39%)
- Roof (37%)
- HVAC (36%)
- Gutters (31%)
- Deck repair (27%)
- Moisture mitigation or water damage repair (25%)
- Sewer/water line (22%)
- Septic tank (21%)
- Foundation or structural repair (17%)
Some repairs are pricier than others. Replacing a roof, which tends to happen every 25 years, can run homeowners over $7,000. And repairing foundation problems cost most homeowners over $4,600, according to HomeAdvisor.[8]
Ongoing Maintenance Services Rack Up Additional Costs for Nearly All Homeowners
Investing in upkeep is rarely a one-time proposition. Four in five of homeowners (80%) pay for ongoing maintenance services.
The most common maintenance services people pay for include:
- Pest control (38%)
- Landscaping (35%)
- Housekeeping (34%)
- Tree trimming (33%)
- Gutter cleaning (30%)
- Pool care (25%)
In addition to the above maintenance services, nearly one-third of homeowners (31%) pay regular fees into an HOA, which typically cost about $200 to $300 each month — adding up to $2,400 to $3,600 annually.
Most Homeowners Would Borrow Money to Pay for an Emergency $5,000 Repair
Homeownership means accepting responsibility for unpredictable expenses.
We asked homeowners how they would primarily cover a $5,000 emergency repair — and the majority (57%) said they'd have to borrow money.
People would pay for an emergency repair with the following:
- Credit card(s) (30%)
- Savings (24%)
- Cash (19%)
- Personal loan (10%)
- Home equity loan, cash-out refinance, and/or HELOC (8%)
- Support from family and/or friends (5%)
Fewer than half of our respondents (43%) could cover a $5,000 emergency home repair with savings or cash.
Among our respondents, one in five have under $1,000 saved in an emergency fund, and one in seven have under $500.
1 in 5 Homeowners Spent $10,000 or More on Improvements in 2021
Nearly 1 in 5 homeowners (18%) spent at least $10,000 on improvements last year, up from 10% in 2019. About one-third (32%) said they spent $5,000 or more last year.
Home improvement costs vary widely and depend on the quality of finishes, the complexity of the project, and more. Among those who spent on improvements:
- 32% of homeowners spent $1-$999.
- 34% of homeowners spent $1,000-$4,999.
- 15% of homeowners spent $5,000-$9,999.
- 12% of homeowners spent $10,000-$20,000.
- 8% of homeowners spent more than $20,000.
A recent Harvard analysis of housing data showed homeowners, on average, spent $3,300 on improvements in 2019.[9] It's worth noting that many homeowners skip improvement projects.
Future Home Improvement Costs Loom Over More Than 90% of Homeowners
Among the homeowners we surveyed, 93% plan to tackle a home improvement project within the next five years.
With Americans spending more time in their yards since the start of the pandemic,[10] the most common renovation plans involve upgrading exteriors such as landscaping and/or patios:
- New landscaping, fencing, and/or yard improvements (43%)
- New or refinished patio, deck, and/or porch (37%)
- New or refinished flooring (36%)
- Bathroom remodel (31%)
- New windows (29%)
- Kitchen remodel (27%)
- Bedroom or living room remodel (25%)
- Pool installation (23%)
- Basement remodel (20%)
- Room addition (19%)
- Bathroom addition (14%)
According to HomeAdvisor,[11] the most expensive home improvement projects include:
- Home addition ($52,157)
- In-ground pool ($49,245)
- Kitchen remodel ($35,317)
- New siding ($14,974)
- Bathroom remodel ($13,401)
| Renovation | Median cost |
|---|---|
| 🧱 Home addition | $52,157 |
| 🏊 In-ground pool | $49,245 |
| 🧑🍳 Kitchen remodel | $35,317 |
| 🏚️ New siding | $13,974 |
| 🛁 Bathroom remodel | $13,401 |
The majority of homeowners planning renovations (60%) expect to use multiple payment methods. The most popular ways to pay for renovations are via savings (56%), cash (44%), and credit cards (41%).
Among homeowners who don't plan to renovate, 18% say they simply can't afford to do so. With the pandemic running up prices for labor and materials, an additional 15% say costs are too inflated, and 14% say the pandemic has created too many delays.
Homeowners Spend More Than $4,800 on Utilities Each Year — Almost Twice as Much as Renters
Another component of a homeowner's budget is the amount they spend on utilities such as electricity, water, gas, and phone service.
The average homeowner's household pays $4,829 on utilities each year — significantly more than the $2,866 spent in the average renter's household, according to the most recent data from the Bureau of Labor Statistics.[12]
Houses tend to be larger living spaces than apartments, making them more expensive to heat, cool, and energize.[13]
Additionally, research shows residential electric bills rose over the course of the pandemic as people spent more time at home.[14]
Property Taxes and Insurance Payments Run the Typical Homeowner More Than $4,000 Each Year
Though costs vary widely by location,[15] the average U.S. homeowner spends $2,578 on property taxes and $1,680 in insurance each year.
Your home's value heavily influences the cost of property taxes. The most expensive states are concentrated in the Northeast, according to Census data.[16]
For example, the typical homeowner in New Jersey pays around $8,400 each year in property taxes (roughly 2.42% on the state's median home value of $348,800) — while the typical Alabama homeowner pays just $609 annually (roughly 0.4% on the state's median home value of $154,000).
Check the chart below to find the median property tax expenses in your state:
Homeowners Insurance Costs Vary Widely by State
Similar to property taxes, costs for homeowners insurance vary significantly depending on your location.
Colorado tends to be the priciest state for insurance, coming in at about $3,383 each year, according to a 2022 analysis.[17] By contrast, Delaware is the least expensive, with homeowners spending about $781 each year.
Below, you can find average home insurance costs in your state.
| Rank ($$$-$) | State | Avg. Annual Cost |
|---|---|---|
| - | National average |
$1,680 |
| 1 | Colorado |
$3,383 |
| 2 | Oklahoma |
$3,321 |
| 3 | Tennessee |
$3,030 |
| 4 | Kansas |
$2,613 |
| 5 | Texas |
$2,554 |
| 6 | Montana |
$2,470 |
| 7 | Nebraska |
$2,444 |
| 8 | Minnesota |
$2,120 |
| 9 | South Dakota |
$2,100 |
| 10 | South Carolina |
$2,032 |
| 11 | Missouri |
$2,031 |
| 12 | Florida |
$1,977 |
| 13 | Kentucky |
$1,967 |
| 14 | Arkansas |
$1,856 |
| 15 | Alabama |
$1,827 |
| 16 | North Dakota |
$1,800 |
| 17 | California |
$1,774 |
| 18 | Massachusetts |
$1,770 |
| 19 | Louisiana |
$1,760 |
| 20 | Georgia |
$1,750 |
| 21 | Rhode Island |
$1,699 |
| 22 | Connecticut |
$1,620 |
| 23 | Virginia |
$1,577 |
| 24 | Mississippi |
$1,572 |
| 25 | Michigan |
$1,552 |
| 26 | New Mexico |
$1,523 |
| 27 | Wyoming |
$1,505 |
| 28 | New York |
$1,500 |
| 29 | Iowa |
$1,435 |
| 30 | North Carolina |
$1,407 |
| 31 | Maryland |
$1,396 |
| 32 | Arizona |
$1,378 |
| 33 | Illinois |
$1,355 |
| 34 | New Hampshire |
$1,326 |
| 35 | Ohio |
$1,299 |
| 36 | Alaska |
$1,293 |
| 37 | Indiana |
$1,214 |
| 38 | Oregon |
$1,198 |
| 39 | New Jersey |
$1,194 |
| 40 | West Virginia |
$1,179 |
| 41 | Washington |
$1,178 |
| 42 | Utah |
$1,136 |
| 43 | Wisconsin |
$1,122 |
| 44 | Nevada |
$1,094 |
| 45 | Hawaii |
$1,086 |
| 46 | Idaho |
$1,055 |
| 47 | Maine |
$982 |
| 48 | Pennsylvania |
$899 |
| 49 | Vermont |
$825 |
| 50 | Delaware |
$781 |
Methodology
The proprietary data featured in this study comes from an online survey commissioned by Clever Real Estate. One thousand U.S. homeowners were surveyed Jan. 5-6, 2022. Each respondent answered up to 21 questions related to their homeownership and financial situation.
Article Sources
About Clever
Since 2017, Clever Real Estate has been on a mission to make selling or buying a home easier and more affordable for everyone. 12 million annual readers rely on Clever's library of educational content and data-driven research to make smarter real estate decisions—and to date, Clever has helped consumers save more than $82 million on realtor fees. Clever's research has been featured in The New York Times,
Business Insider, Inman, Housing Wire, and many more.
More Research From Clever


FAQs
What are the hidden costs of buying a house?
Ongoing costs such as utilities, maintenance, taxes, and more lead to the average homeowner spending $15,405 each year — on top of upfront costs and a mortgage. Learn more about recurring expenses here.
How much of their income do homeowners spend on their houses?
As of 2022, nearly half of U.S. homeowners spend over 30% of their gross monthly income on their house. Learn more about the ongoing
costs homeowners have to keep up with.
What are homeowners' most common maintenance expenses?
Nearly half of homeowners have had to work on or repair paint jobs, major appliances, plumbing, and electrical problems. Learn more
about the annual costs of home maintenance.