
🕺 Laissez les bons temps rouler 💃
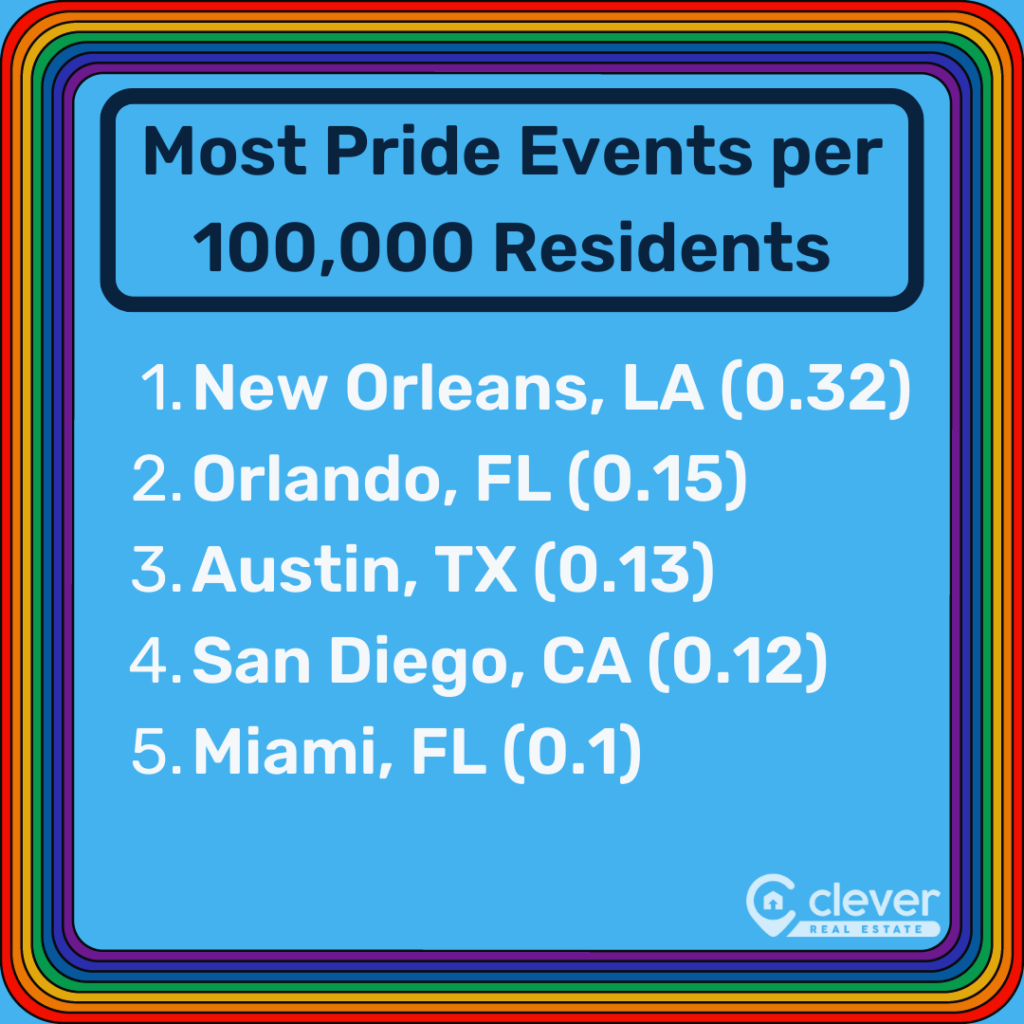
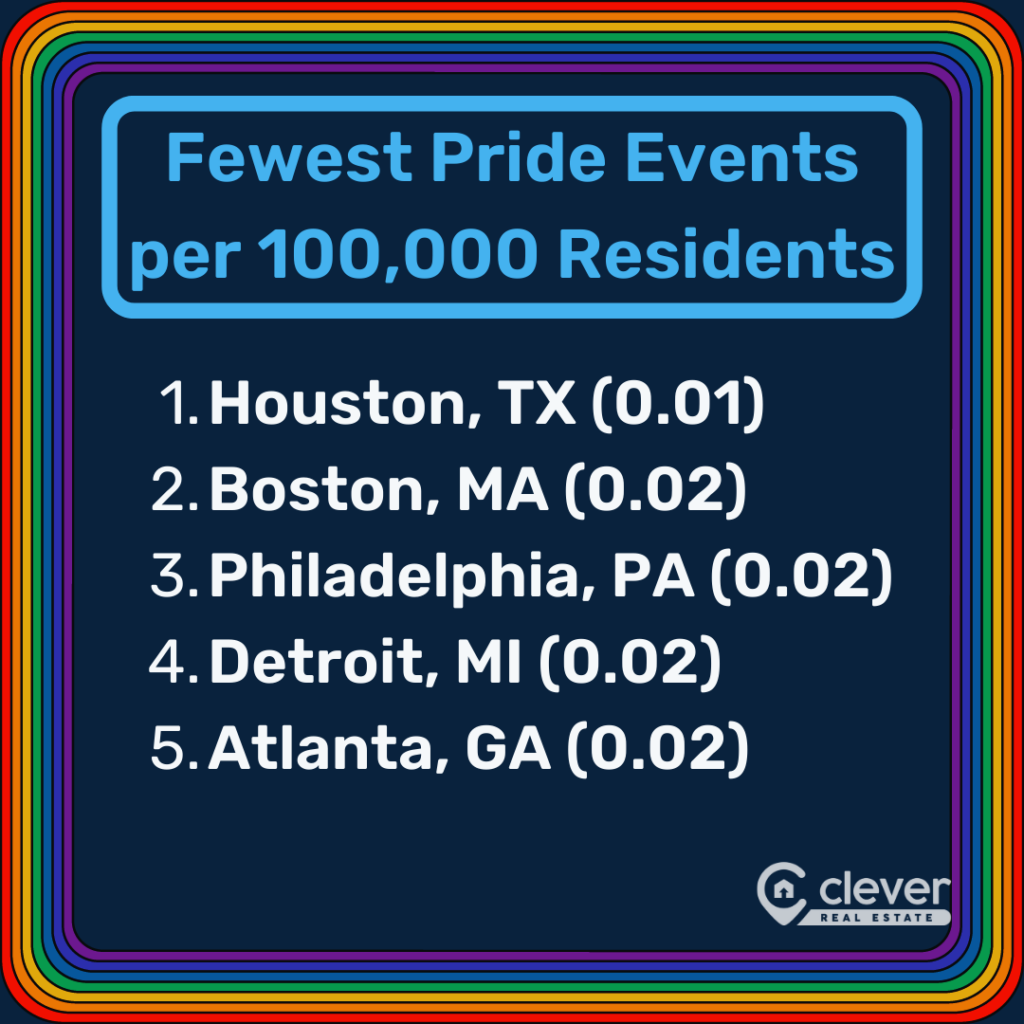
New Orleans has the most pride events per capita out of all metros studied. It hosts 0.32 pride events per every 100,000 residents — nearly 5x more than the average city (0.07).
Most LGBTQ-Friendly Cities, Ranked | 15 Most LGBTQ-Friendly Cities | Top Cities by Category | 10 Least LGBTQ-Friendly Cities | Methodology | FAQ
Policies pertaining to LGBTQ+ Americans and their rights have dominated headlines over the past year. Recently passed anti-LGBTQ legislation has underscored the urgent need to examine the most LGBTQ-friendly cities in America as many LGBTQ Americans announce they're on the move to more accepting cities, states, and even countries.
The Human Rights Campaign declared a "state of emergency" for LGBTQ Americans and issued a national warning and guidebook, which highlights the ongoing struggles this community faces. We found in prior research that 38% of Americans still oppose same-sex marriage, a sobering reminder that the fight for equality is far from over.
Amid these challenges, we find glimmers of hope and resilience in various corners of the U.S. Pittsburgh's city council passed bills aimed at protecting the LGBT community, while Kansas City proudly declared itself an LGBTQ sanctuary city. Notably, New York City hosts one of the world's largest pride celebrations, attracting a staggering 2 million attendees and showcasing the vibrant and resilient spirit of its LGBTQ community.
Our study not only balances the fun aspects of the LGBTQ community but also the political realities necessary for LGBTQ Americans to thrive when they are moving across state lines for better futures amid rising costs of living.
To identify which cities are the most LGBTQ-friendly, our weighted rankings evaluated the following criteria:
- 7x: Percent of state population that is LGBTQ
- 7x: Parents, Families and Friends of Lesbians and Gays (PFLAG) chapters per 100,000 residents
- 6x: Designated LGBTQ-affirming health care providers per capita
- 6x: Number of anti-trans legislation passed at the state level
- 6x: Pride events per 100,000 residents
- 5x: National LGBT Chamber of Commerce chapters
- 5x: Percentage of residents opposing to anti-discrimination laws
- 5x: Gay bars per 100,000 residents
- 3x: Percentage of residents opposing same-sex marriage
- 3x: Municipal equality score
- 3x: State equality tally score
- 3x: Inclusive curricular standards
- 2x: Parental opt-out laws
- 2x: "Don't Say Gay" laws
Find out how the 50 most-populous metros in the U.S. stack up against each other in terms of LGBTQ-friendliness.
Most LGBTQ-Friendly Cities Stats 🏳️🌈
- San Francisco is America's most LGBTQ-friendly city, while Memphis is the least friendly. Jump to section👇
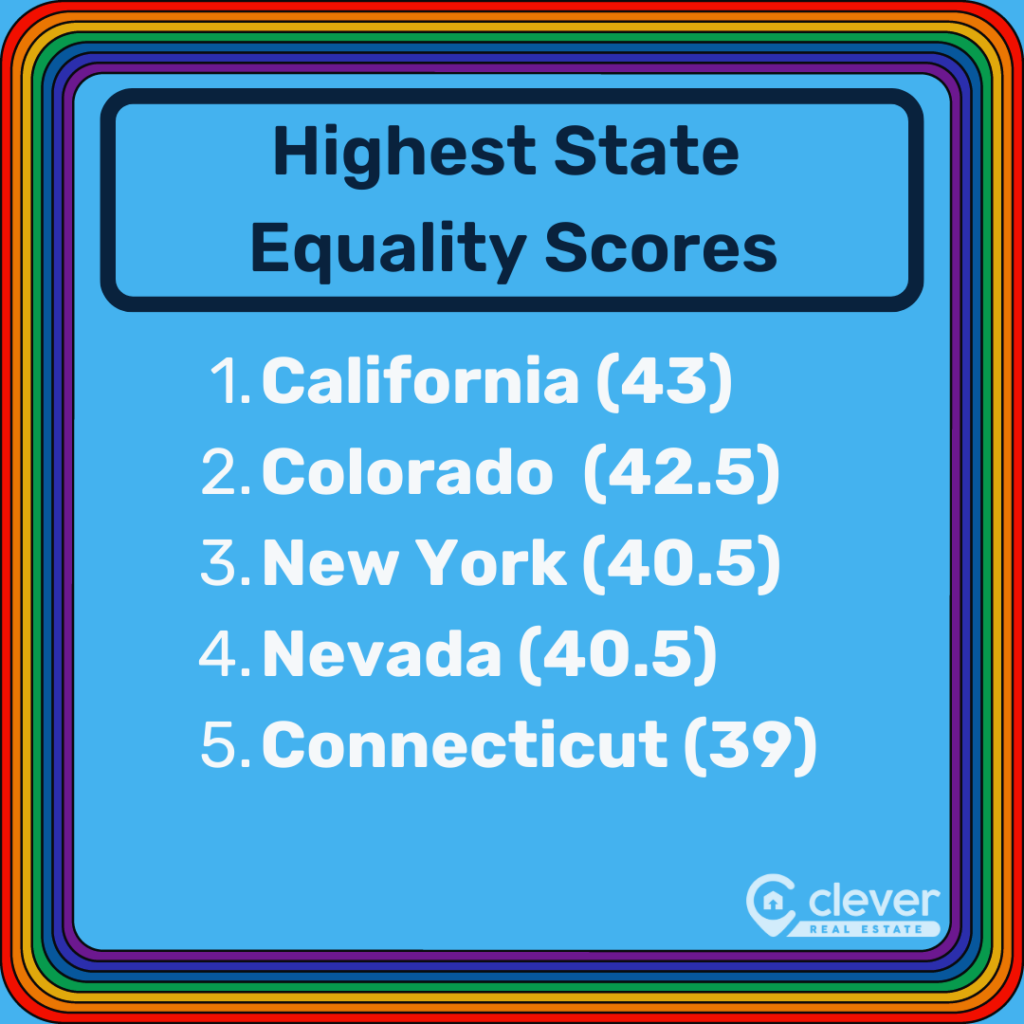
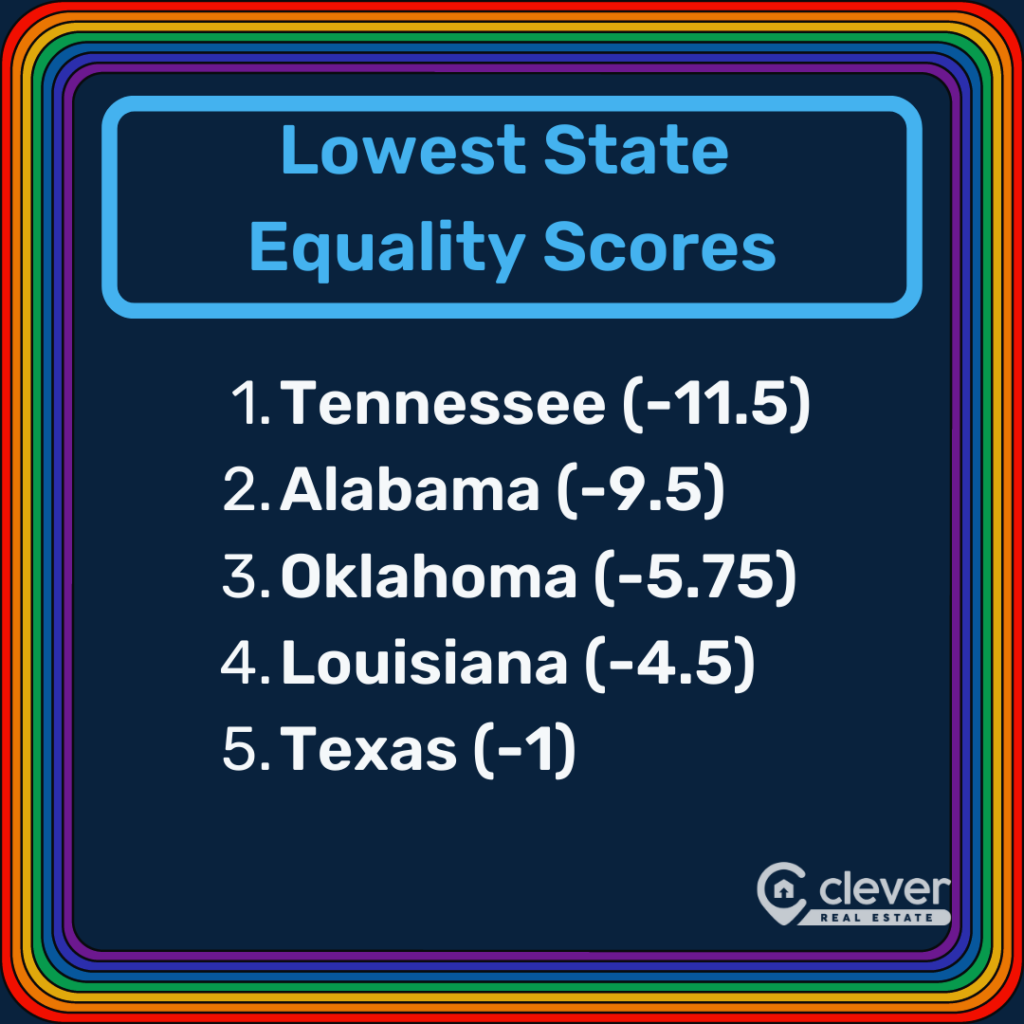
- California has the highest state equality tally score (100), while Tennessee has the lowest (-11.5).👇
- Fifteen of the 50 most-populous metros in the U.S. are located in states with "Don't Say Gay" laws.👇
- New Orleans has the most pride celebrations per capita (0.32), while Houston has the fewest (0.01).👇
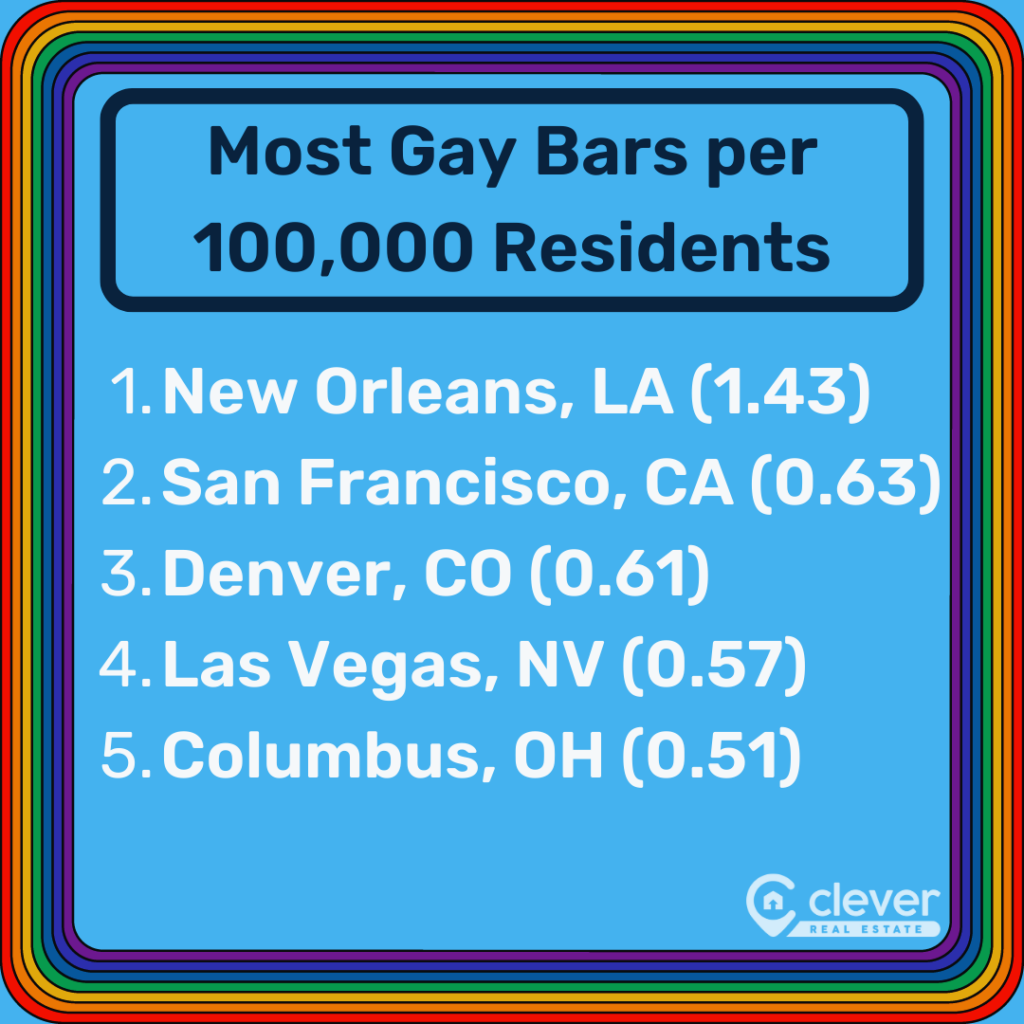
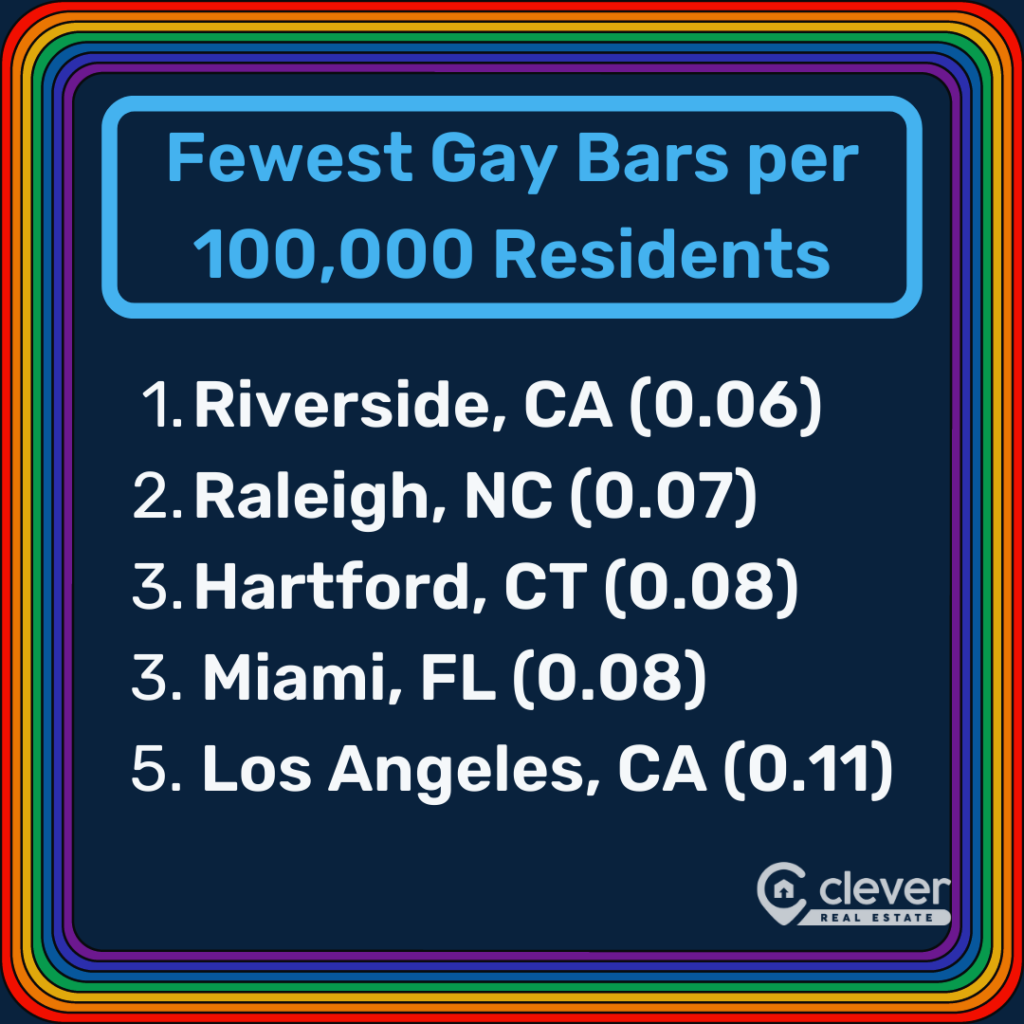
- New Orleans has the most gay bars per 100,000 residents (1.43), while Riverside, California, has the fewest (0.06).👇
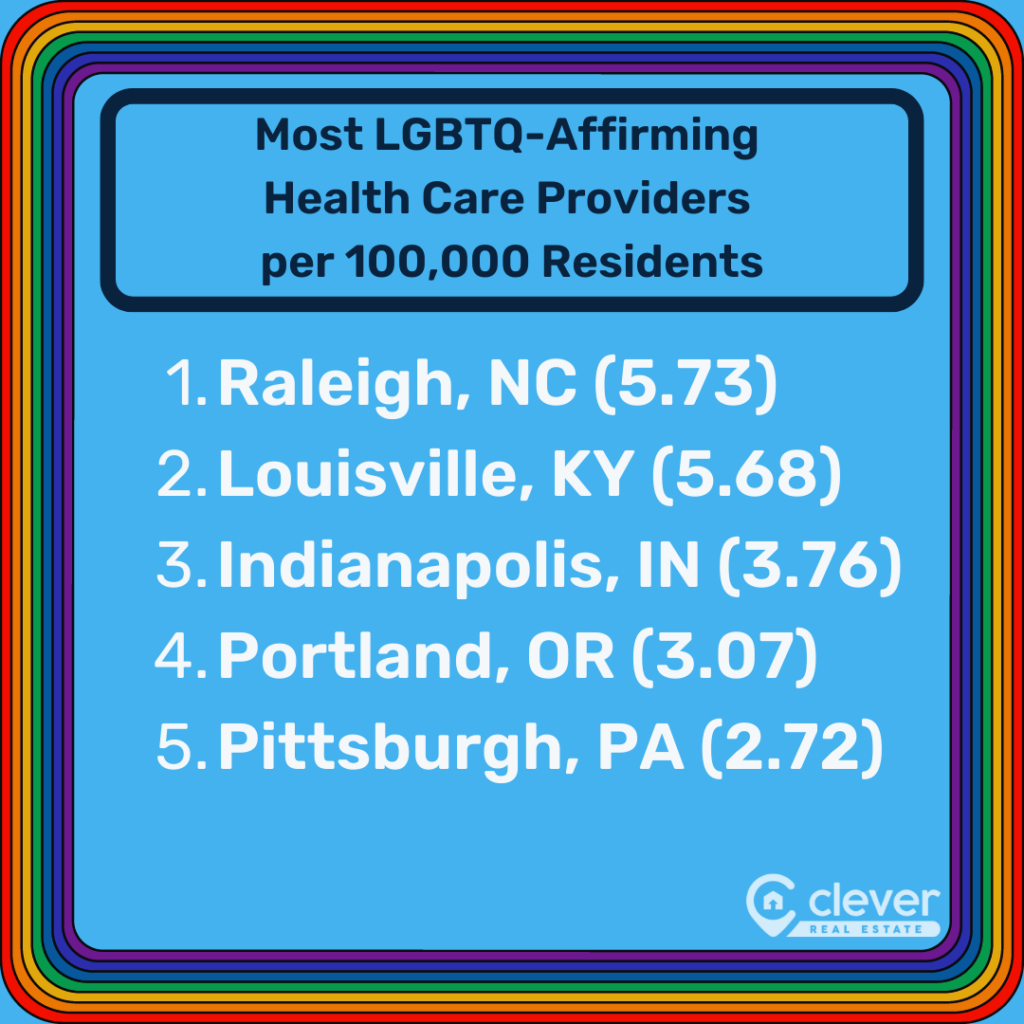
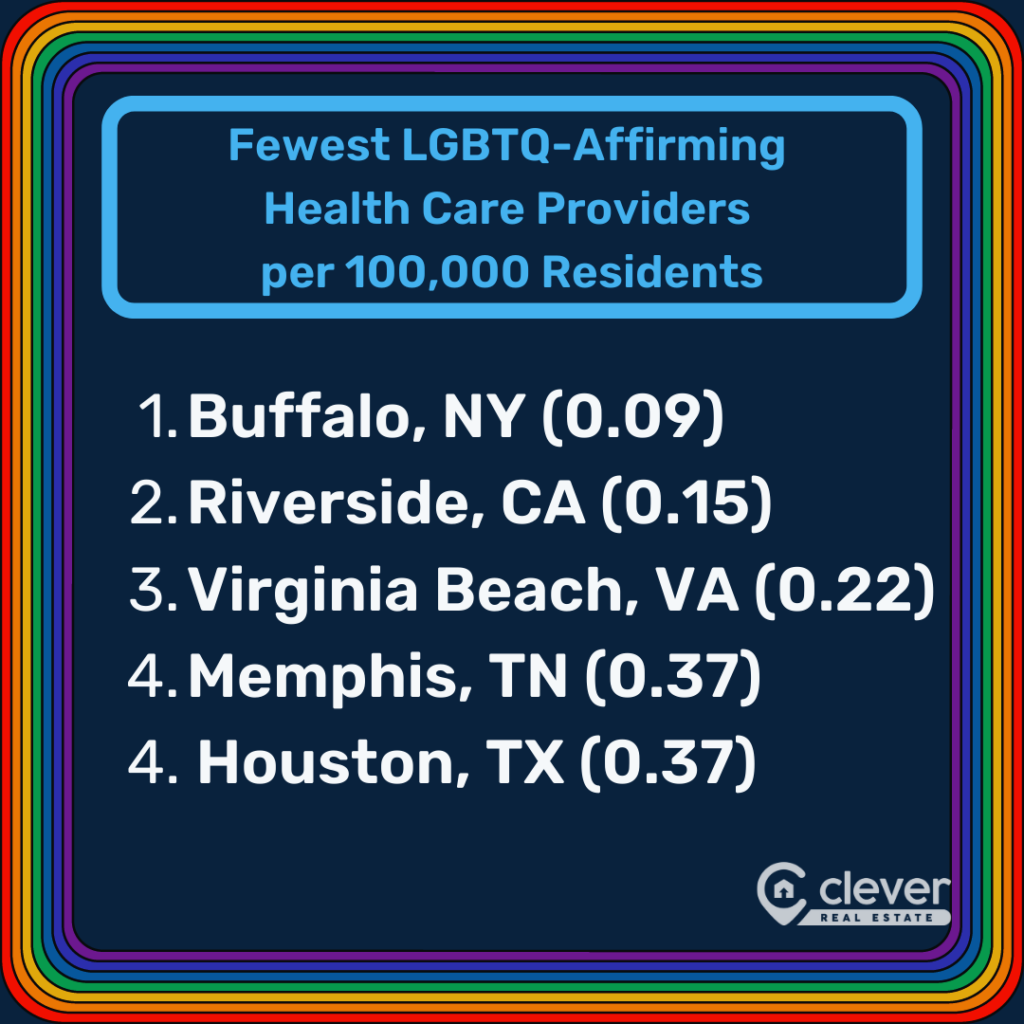
- Raleigh, North Carolina, has the highest number of LGBTQ-affirming health care providers per capita (5.73), while Buffalo, New York, has the lowest at just 0.09 providers per capita.👇
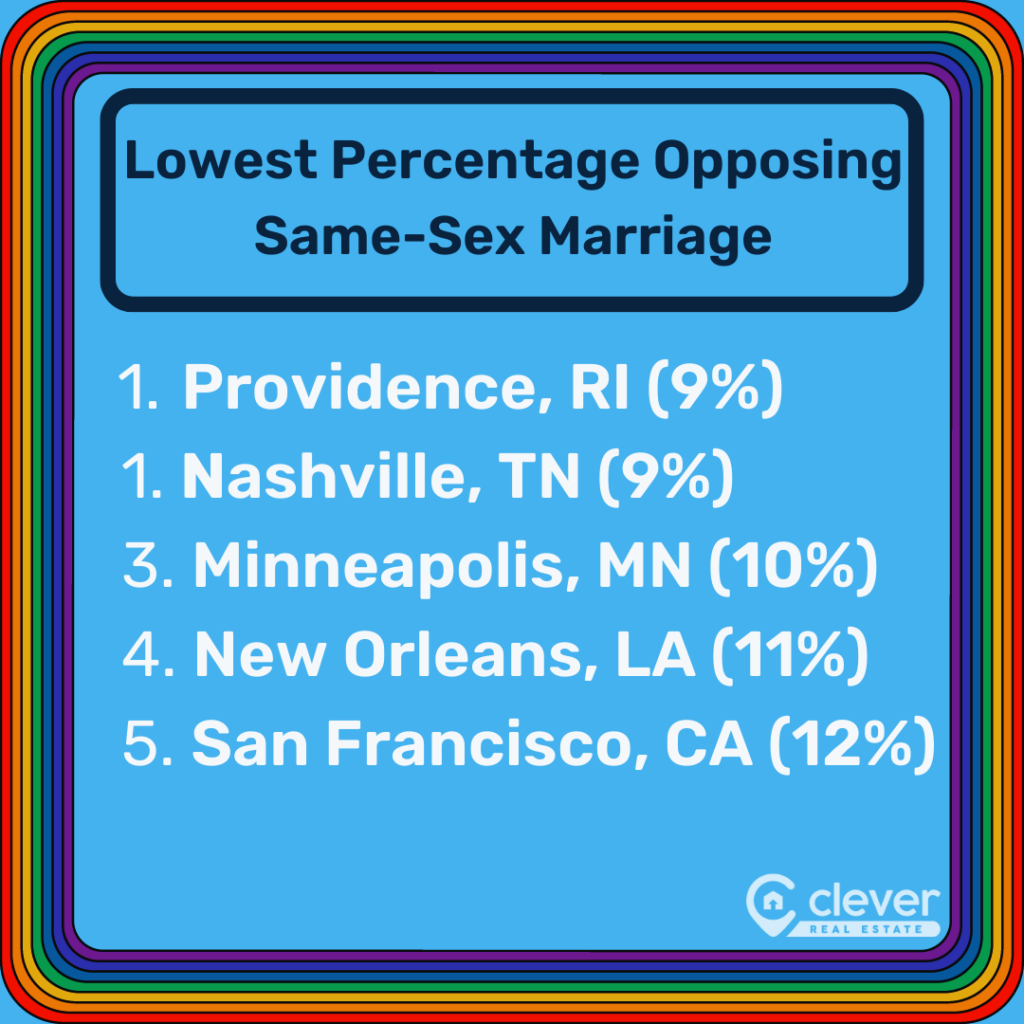
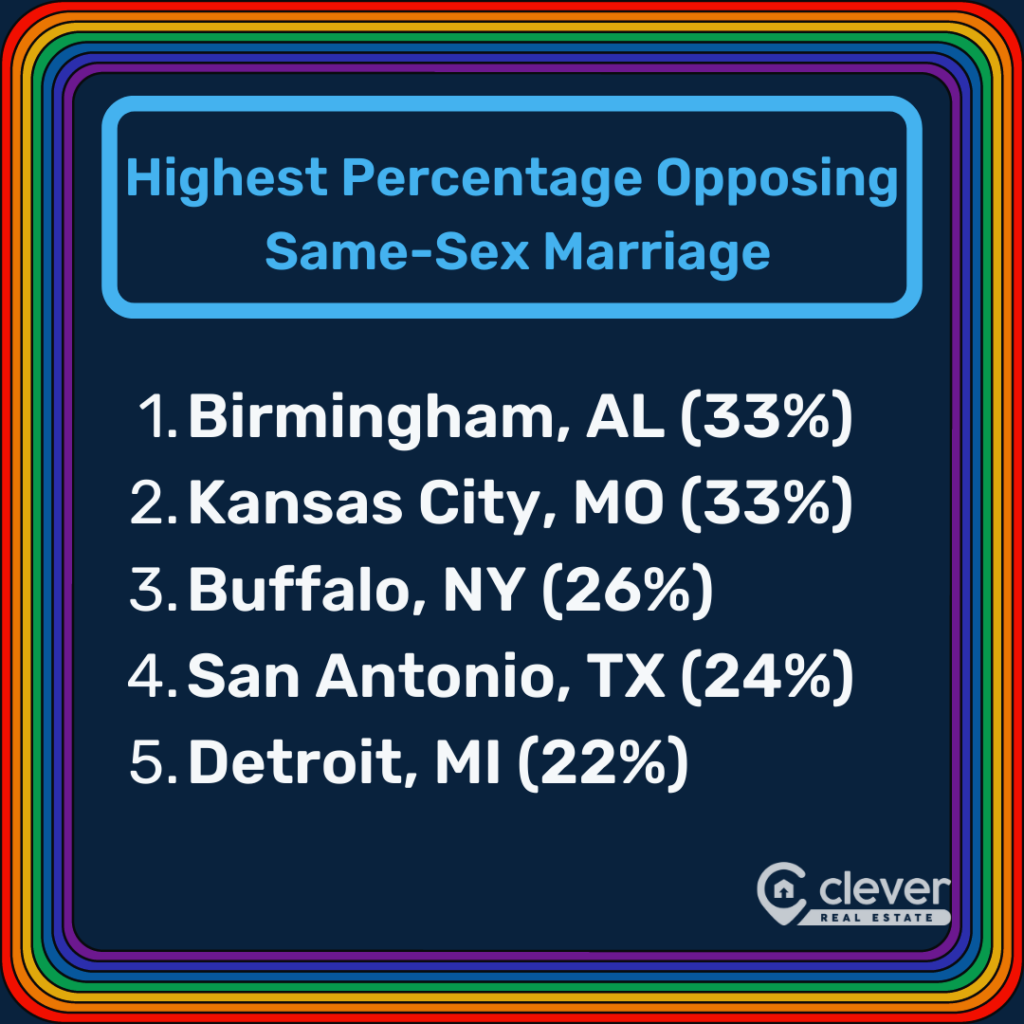
- Providence, Rhode Island, and Nashville, Tennessee, residents are the most supportive of anti-discrimination laws. Just 9% of residents oppose them. Kansas City, Missouri, and Birmingham, Alabama, have the highest opposition rate at 33%.👇
The 50 Most LGBTQ-Friendly Cities, Ranked
| Rank | Metro | State LGBTQ Population (%) | Gay Bars per Capita | Pride Events per Capita | Municipal Equality Score* | State Equality Tally Score** | State LGBTQ+ Inclusive Curricular Standards | State Parental Opt-Out Laws | State "Don't Say Gay" Laws | PFLAG Chapters per Capita*** | NGLCC Chapters**** | LGBTQ Affirming Health Care Providers per Capita***** | State Anti-Trans Legislation Passed | % of Residents Opposing Non-Discrimination Laws | % of Residents Opposing Same-Sex Marriage |
| - | Study Average | 5.1 | 0.3 | 0.07 | 95 | 16.7 | N | N | N | 0.08 | 0.9 | 1.4 | 1.7 | 19% | 27% |
| 1 | San Francisco, CA | 6 | 0.63 | 0.09 | 100 | 43 | Y | N | N | 0.13 | 2 | 1.73 | 0 | 12% | 21% |
| 2 | Hartford, CT | 5 | 0.08 | 0.08 | 100 | 39 | Y | N | N | 0.25 | 1 | 1.65 | 0 | 22% | 11% |
| 3 | Las Vegas, NV | 6 | 0.57 | 0.22 | 100 | 40.5 | Y | N | N | 0.04 | 1 | 0.39 | 0 | 12% | 19% |
| 4 | Portland, OR | 8 | 0.36 | 0.04 | 100 | 38.5 | Y | N | N | 0.04 | 1 | 3.07 | 0 | 20% | 17% |
| 5 | Denver, CO | 6 | 0.61 | 0.03 | 100 | 42.5 | Y | N | N | 0.07 | 1 | 1.75 | 0 | 17% | 15% |
| 6 | Los Angeles, CA | 6 | 0.11 | 0.07 | 100 | 43 | Y | N | N | 0.07 | 2 | 0.58 | 0 | 15% | 25% |
| 7 | San Diego, CA | 6 | 0.37 | 0.12 | 100 | 43 | Y | N | N | 0.03 | 1 | 1 | 0 | 14% | 18% |
| 8 | Sacramento, CA | 6 | 0.29 | 0.04 | 100 | 43 | Y | N | N | 0.08 | 1 | 0.79 | 0 | 17% | 26% |
| 9 | Chicago, IL | 5 | 0.22 | 0.05 | 100 | 37.5 | Y | N | N | 0.11 | 1 | 0.79 | 0 | 15% | 25% |
| 10 | New Orleans, LA | 5 | 1.43 | 0.32 | 100 | -4.5 | N | N | Y | 0.08 | 1 | 1.82 | 1 | 11% | 31% |
| 11 | San Jose, CA | 6 | 0.26 | 0.05 | 97 | 43 | Y | N | N | 0.05 | 0 | 1.23 | 0 | 17% | 13% |
| 12 | Richmond, VA | 5 | 0.3 | 0.08 | 100 | 25.5 | N | N | N | 0.15 | 1 | 1.29 | 0 | 21% | 20% |
| 13 | Pittsburgh, PA | 4 | 0.25 | 0.08 | 100 | 16.5 | N | N | N | 0.08 | 1 | 2.72 | 0 | 14% | 18% |
| 14 | Baltimore, MD | 5 | 0.18 | 0.04 | 100 | 31.5 | N | N | N | 0.14 | 1 | 1.76 | 0 | 19% | 27% |
| 15 | Milwaukee, WI | 6 | 0.45 | 0.06 | 100 | 18.5 | N | N | N | 0.13 | 1 | 0.83 | 0 | 20% | 24% |
| 16 | Minneapolis, MN | 4 | 0.22 | 0.03 | 100 | 36 | N | N | N | 0.03 | 1 | 2.06 | 0 | 10% | 17% |
| 17 | Boston, MA | 6 | 0.12 | 0.02 | 100 | 36 | N | N | N | 0.02 | 1 | 1.49 | 0 | 15% | 16% |
| 18 | Seattle, WA | 5 | 0.47 | 0.05 | 100 | 38.25 | N | N | N | 0.02 | 1 | 2.02 | 0 | 18% | 23% |
| 19 | Cleveland, OH | 5 | 0.34 | 0.1 | 100 | 10.75 | N | N | N | 0.05 | 1 | 1.78 | 0 | 16% | 27% |
| 20 | New York, NY | 5 | 0.37 | 0.04 | 100 | 40.5 | N | N | N | 0.05 | 1 | 0.49 | 0 | 16% | 28% |
| 21 | Providence, RI | 6 | 0.36 | 0.06 | 100 | 33 | N | N | N | 0.06 | 0 | 1.07 | 0 | 9% | 32% |
| 22 | Philadelphia, PA | 4 | 0.14 | 0.02 | 100 | 16.5 | N | N | N | 0.14 | 1 | 1.3 | 0 | 20% | 23% |
| 23 | Riverside, CA | 6 | 0.06 | 0.02 | 100 | 43 | Y | N | N | 0 | 0 | 0.15 | 0 | 17% | 19% |
| 24 | Washington, DC | 5 | 0.25 | 0.05 | 100 | 38.5 | N | N | N | 0.05 | 1 | 0.38 | 0 | 18% | 25% |
| 25 | Indianapolis, IN | 5 | 0.14 | 0.05 | 80 | 0 | N | N | Y | 0.14 | 1 | 3.76 | 3 | 16% | 25% |
| 26 | Columbus, OH | 5 | 0.51 | 0.05 | 100 | 10.75 | N | N | N | 0.05 | 1 | 2.14 | 0 | 18% | 35% |
| 27 | Louisville, KY | 3 | 0.23 | 0.08 | 100 | 5.25 | N | N | Y | 0.08 | 1 | 5.68 | 2 | 15% | 38% |
| 28 | Detroit, MI | 4 | 0.18 | 0.02 | 100 | 22 | N | N | N | 0.09 | 1 | 0.78 | 0 | 22% | 24% |
| 29 | Charlotte, NC | 5 | 0.19 | 0.04 | 86 | 7.25 | N | N | Y | 0.15 | 2 | 1.37 | 3 | 21% | 30% |
| 30 | Salt Lake City, UT | 6 | 0.32 | 0.08 | 100 | 9.25 | N | N | N | 0.08 | 1 | 1.98 | 4 | 17% | 38% |
| 31 | Austin, TX | 5 | 0.26 | 0.13 | 100 | -1 | N | N | Y | 0.09 | 1 | 2.21 | 4 | 16% | 23% |
| 32 | Atlanta, GA | 4 | 0.21 | 0.02 | 100 | -0.5 | N | N | N | 0.13 | 1 | 1.2 | 1 | 14% | 34% |
| 33 | Cincinnati, OH | 5 | 0.27 | 0.04 | 100 | 10.75 | N | N | N | 0.09 | 0 | 1.5 | 0 | 19% | 24% |
| 34 | Raleigh, NC | 5 | 0.07 | 0.07 | 85 | 7.25 | N | N | Y | 0.07 | 1 | 5.73 | 3 | 16% | 45% |
| 35 | Virginia Beach, VA | 5 | 0.17 | 0.06 | 100 | 25.5 | N | N | N | 0.06 | 0 | 0.22 | 0 | 21% | 20% |
| 36 | Phoenix, AZ | 6 | 0.26 | 0.02 | 100 | 6 | N | Y | N | 0 | 1 | 0.44 | 0 | 18% | 27% |
| 37 | Buffalo, NY | 5 | 0.34 | 0.09 | 94 | 40.5 | N | N | N | 0.09 | 0 | 0.09 | 0 | 26% | 46% |
| 38 | Nashville, TN | 3 | 0.35 | 0.05 | 77 | -11.5 | N | Y | N | 0.2 | 1 | 0.94 | 10 | 9% | 15% |
| 39 | San Antonio, TX | 5 | 0.38 | 0.04 | 100 | -1 | N | N | Y | 0.08 | 1 | 0.92 | 4 | 24% | 16% |
| 40 | Orlando, FL | 5 | 0.22 | 0.15 | 100 | -0.75 | N | Y | Y | 0.04 | 1 | 1.23 | 5 | 18% | 16% |
| 41 | Kansas City, MO | 5 | 0.27 | 0.05 | 100 | -0.25 | N | N | N | 0.05 | 2 | 0.95 | 3 | 33% | 35% |
| 42 | St. Louis, MO | 5 | 0.21 | 0.04 | 100 | -0.25 | N | N | N | 0.07 | 0 | 0.89 | 3 | 20% | 25% |
| 43 | Tampa, FL | 5 | 0.28 | 0.03 | 100 | -0.75 | N | Y | Y | 0.12 | 1 | 1.09 | 5 | 16% | 26% |
| 44 | Oklahoma City, OK | 4 | 0.42 | 0.07 | 78 | -5.75 | N | N | Y | 0.14 | 0 | 1.04 | 3 | 18% | 30% |
| 45 | Dallas, TX | 5 | 0.24 | 0.04 | 100 | -1 | N | N | Y | 0.04 | 1 | 0.57 | 4 | 22% | 22% |
| 46 | Miami, FL | 5 | 0.08 | 0.1 | 89 | -0.75 | N | Y | Y | 0.03 | 2 | 0.72 | 5 | 17% | 32% |
| 47 | Birmingham, AL | 5 | 0.18 | 0.09 | 100 | -9.5 | N | N | Y | 0.18 | 0 | 0.9 | 2 | 33% | 35% |
| 48 | Jacksonville, FL | 5 | 0.12 | 0.06 | 79 | -0.75 | N | Y | Y | 0.06 | 0 | 0.61 | 5 | 14% | 11% |
| 49 | Houston, TX | 5 | 0.22 | 0.01 | 73 | -1 | N | N | Y | 0.03 | 1 | 0.37 | 4 | 20% | 29% |
| 50 | Memphis, TN | 3 | 0.22 | 0.07 | 54 | -11.5 | N | Y | N | 0 | 1 | 0.37 | 10 | 14% | 36% |
| *100-point scale **43.5-point tally scale ***Parents, Families and Friends of Lesbians and Gays chapters ****National LGBT Chamber of Commerce chapters *****Within a 25-mile radius | |||||||||||||||
The 15 Most LGBTQ-Friendly Cities
With five cities in the top 15 — including San Francisco, our No. 1 LGBTQ-friendly city — California is the most LGBTQ-friendly state. In terms of its policies, it has a near-perfect equality tally score of 43 out of 43.5, which is attractive to LGBTQ Americans looking to move to more inclusive states.
In addition to laws passed by their state congresses, the top 15 cities have enacted municipal laws that protect their residents. The top 15 cities have an average city municipal equality score of 99 out of 100.
Only one city in the top 15 is located in a state that has passed anti-trans legislation. Louisiana may have restrictive laws, but New Orleans stands out from other cities in the South.
The top 15 cities, of course, have a high number of gay bars per capita: 0.4 per 100,000 residents on average — compared to 0.22 in the bottom 10 cities.
Despite hosting the world's largest Pride celebration, New York City didn't make the top 15 — coming in at No. 20 instead. New York City has a particularly low number of PFLAG chapters, with just 0.05 per 100,000 residents — 38% fewer than the average metro (0.08).
It also has just 0.49 LGBT-affirming health care providers per 100,000, which is 65% fewer than the average metro in our study (1.4). There are also no inclusive curricular standards in the state of New York.
1. San Francisco, CA
| 🌈 Rainbow Families San Francisco need not prove why it's the No. 1 most LGBTQ-friendly city, as it's already a popular destination for LGBTQ tourists. LGBTQ locals are also in luck: The Bay Area has 0.13 PFLAG chapters per 100,000 residents, 63% more than the average metro in our study (0.08). |
San Francisco got a big boost for being located in a state with such inclusive policies for LGBTQ Americans. However, it boasts some impressive stats on its own.
With a remarkable 0.63 gay bars per 100,000 residents, it soars 110% above the average city in our study, making it a vibrant hotspot for LGBTQ+ nightlife and culture. But it's not just about the party scene. San Franciscans are more inclusive than average, with only 12% opposing non-discrimination laws for LGBTQ Americans — 37% lower than the national average of 19%.
At 6% of its total population, San Francisco's LGBTQ community slightly surpasses the national proportion of 5.1%, solidifying its status as a welcoming and diverse haven.
» Read more stats on California
2. Hartford, CT
| 🏛️ Representin' Hartford is the only Connecticut city in the 50 most-populous metros in the U.S. As such, it gets to represent its state in our study, and its residents should be proud! Connecticut's state equality tally score is 39 — 134% higher than the average state's tally score of 16.7. |
Hartford is the third-smallest metro in the study, so it has just 0.08 gay bars per 100,000 residents, which is tied with Miami for the third-lowest number. That's 73% fewer gay bars than the average city in our study (0.3).
However, it makes up for this by having a more inclusive and supportive community than other cities. The Hartford metro area has 0.25 PFLAG chapters per 100,000 resident – 213% more than the average metro in our study (0.08). Additionally, just 11% of Hartford residents oppose same-sex marriage, the lowest percentage in the study. That's 59% fewer than the national response of 27%.
» Read more stats on Connecticut
3. Las Vegas, NV
| 🎰 Pride Jackpot As a city known for its nightlife and party scene, it may come as no surprise that Pride Month in Las Vegas is exceptional. The Las Vegas metro area has 0.22 pride events per 100,000 residents annually — 214% more than the average metro in our study (0.07). |
Las Vegas doesn't just dazzle on the famous Strip. It shines as an oasis of LGBTQ inclusivity. Just 19% of its residents oppose same-sex marriage. That's 30% fewer than the average city in our study (27%).
Keeping with its image, Las Vegas also boasts 0.57 gay bars per 100,000 residents — 90% more than the average city in our study (0.3). Las Vegas is home to the popular Hamburger Mary's and The Phoenix Bar & Lounge, both staples of the LGBTQ community.
With a state equality tally score of 40.5, Nevada as a whole scores an impressive 143% above the average state's tally score of 16.7.
» Read more stats on Nevada
4. Portland, OR
| 🧑🤝🧑 In Good Company Boosting Portland's rank is its location in Oregon, the state with the largest percentage of LGBTQ residents. Oregon's LGBTQ population of 8% is 57% more than the national proportion of 5.1%. |
When it comes to LGBTQ inclusivity, Portland isn't just leading the way, it's also setting the pace. With an impressive 3.07 LGBTQ-affirming health care providers per 100,000 residents, it rises 119% above the average metro in our study (1.4), ensuring the community's health care needs are met with care and compassion.
Oregon's commitment to equality is also undeniable, with a state equality tally score of 38.5, an astonishing 131% higher than the average state's score of 16.7. Portland also benefits from having a thriving LGBTQ community. With 0.36 gay bars per 100,000 residents, Portland is home to 20% more than the average city in our study (0.3).
» Read more stats on Oregon
5. Denver, CO
| 🤲 Sound State Cementing Colorado's reputation as a progressive state and Denver's allure to the LGBTQ community, Colorado's state equality tally score is 42.5 — 154% higher than the average state's tally score of 16.7 |
In Denver, diversity thrives. With a stunning 0.61 gay bars per 100,000 residents, it stands 103% above the average city in our study (0.3). This city doesn't just embrace love, it also champions it, with only 15% opposing same-sex marriage, a substantial 44% lower than the national average (27%).
Moreover, Denver ensures access to compassionate health care, boasting an estimated 1.75 LGBTQ-affirming health care providers per 100,000 residents, a solid 25% more than the average metro in our study (1.4).
» Read more stats on Colorado
6. Los Angeles, CA
| 🎬 Lights, Camera, Action Like San Francisco, Los Angeles is another Californian city known for its LGBTQ community. It's the filming location of community staples such as RuPaul's Drag Race and Dragula. It is also known for the iconic neighborhoods of West Hollywood and Silver Lake, which are home to several notable gay bars. |
The number of annual pride events in Los Angeles is tied with the national average at 0.07 per 100,000 residents. The L.A. Pride Festival & Parade is one of the most well-attended pride events in the country, with an estimated 146,000 attending last year.
Los Angeles is also slightly more tolerant than other U.S. cities. Just 15% oppose non-discrimination laws, a noteworthy 21% less than the national average of 19%. Moreover, when it comes to same-sex marriage, the city stands out with only 25% opposing, a commendable 7% below the national average of 27%.
7. San Diego, CA
| 💃 Time to Party In "America's Finest City," the pride truly shines through, boasting an impressive 0.12 pride events per 100,000 residents annually, a spirited 71% above the average in our study. |
San Diego has long been a popular LGBTQ destination, dating to the 1950s when venues like Bradley's and Blue Jacket attracted travelers from all over the country. These days, the iconic Gossip Grill – a bustling lesbian-centered bar and grill – is a community standout that is a hot spot for LGBTQ tourists and locals alike.
Given its illustrious LGBTQ history, it's no surprise that people in San Diego are more progressive when it comes to LGBTQ topics. Just 14% of San Diego residents oppose non-discrimination laws, which is 26% lower than the national response of 19%. Furthermore, only 18% are in opposition to same-sex marriage, a significant 33% less than the overall national response of 27%.
8. Sacramento, CA
| 🏆 10s Across the Board Sacramento is yet another California city with a commitment to protecting the rights of LGBTQ residents. It has a perfect municipal equality score of 100. |
In Sacramento, just 17% of residents oppose non-discrimination laws — 11% below the national average of 19%. Additionally, only 26% oppose same-sex marriage, a heartening 4% lower than the national average of 27%.
But Sacramento doesn't stop there — it's a city that actively fosters LGBTQ+ inclusivity. It boasts a National Gay and Lesbian Chamber of Commerce and the Sacramento LGBT Community Center, demonstrating its dedication to providing resources and opportunities for the LGBTQ+ community to thrive.
9. Chicago, IL
| 📜 Legislating by Example When it comes to state policies concerning LGBTQ+ rights, Illinois stands out with an impressive state equality tally score of 37.5, surpassing the average state's tally score of 16.7 by a remarkable 125%. |
Chicago has a reputation for being a progressive city in the Midwest, and the stats support that view. Chicago is home to 0.11 PFLAG chapters per 100,000 residents – 38% above the average metro in the study (0.08).
Chicagoans also seem to be a bit more tolerant than Americans in other cities. Only 15% of its residents oppose non-discrimination laws, a remarkable 21% lower than the national average of 19%. Moreover, just 25% oppose same-sex marriage, a modest 7% lower than the national response of 27%.
» Read more stats on Illinois
10. New Orleans, LA
| 🎭 A Southern Standout Despite being in a state with a low equality tally score (-4.5), New Orleans' LGBTQ community continues to thrive. New Orleans is home to 1.43 gay bars per 100,000 residents — the highest in the study! That's 5x more than the average city (0.3). |
With 0.32 pride events per 100,000 residents annually, New Orleans has 357% more pride events than the average metro in our study (0.07). It proudly claims the title of most pride events per capita, proving that in NOLA, celebration knows no bounds.
But New Orleans doesn't just stop at parades and parties. It is home to 1.82 LGBTQ-affirming health care providers per 100,000, which is 30% more than the national average (1.4).
When it comes to inclusivity, NOLA is an example in the South. Just 11% of its residents oppose non-discrimination laws — 42% lower than the national average of 19%.
» Read more stats on Louisiana
11. San Jose, CA
| 💫 Well-Rounded Compared to other California cities, San Jose ranks the lowest, only above Riverside. However, given that California is one of the highest-ranked states in terms of equality, San Jose still proves to be an LGBTQ-friendly city. |
In the heart of Silicon Valley, San Jose charts its unique course when it comes to LGBTQ+ inclusivity. Although it has 12% fewer LGBTQ-affirming health care providers per 100,000 residents than the average metro area (1.4), it's buoyed by its location in a progressive state and a near-perfect municipal equality score of 97 out of 100.
Its residents are also more tolerant than those in other cities. With just 17% opposing non-discrimination laws, it stands 11% below the national average of 19%. Moreover, in the realm of love and marriage, San Jose is a leading city with only 13% opposing same-sex marriage, a remarkable 52% lower than the national average of 27%.
12. Richmond, VA
| 🤝 Rich in Friends Richmond not only boasts a perfect municipal equality score of 100, it's also home to 0.15 PFLAG chapters per 100,000 residents — 88% more than the national average — making it another standout LGBTQ city in the South. |
Although Virginia could improve its policies pertaining to LGBTQ rights, its state equality score of 25.5 is still 53% higher than the average state's score of 16.7.
Richmond, specifically, is slightly more tolerant than other cities in the country. Just 20% of Richmond residents oppose same-sex marriage — compared to 27% nationally.
When it's time to celebrate, Richmond knows how to do it right with a spirited 0.08 pride events per 100,000 residents annually, a robust 14% more than the average metro in our study.
» Read more stats on Virginia
13. Pittsburgh, PA
| 🏥 An Abundance of Care Pittsburgh is another standout when it comes to LGBTQ health care accessibility, offering 2.72 LGBTQ-affirming health care providers per 100,000 residents. That's 94% higher than the average metro in our study, ensuring that the community's medical needs are well-cared for. |
Pittsburgh is leading the way in municipal policies that protect LGBTQ residents. These policies are backed by a thriving community whose culture is also putting Pittsburgh on the map as an LGBTQ destination.
Pittsburgh hosts 0.08 pride events per 100,000 residents each year — 14% more than the average metro in our study (0.07).
But Pittsburgh isn't just about parades. It's also a city of acceptance. With just 14% of residents opposing non-discrimination laws, there are 26% fewer Pittsburghers in opposition to these protections than the national average (19%).
» Read more stats on Pennsylvania
14. Baltimore, MD
| ⚖️ Tipping the Scales While not perfect, Maryland does stand out from the crowd. With a state equality tally score of 31.5, Maryland's score is 89% higher than the average score of 16.7. |
With an impressive 0.14 PFLAG chapters per 100,000 residents, Baltimore is home to 75% more PFLAG chapters than the average city (0.08). Baltimore also champions health care accessibility, boasting an estimated 1.76 LGBTQ-affirming health care providers per 100,000 residents — 26% more than the national average (1.4).
Although Maryland's LGBTQ+ population hovers just below the national proportion at 5%, Baltimore stands out with its dedication to progress. It not only hosts an NGLCC chapter, but it also proudly boasts a perfect municipal equality score of 100, showcasing a commitment to ensuring LGBTQ rights are protected via policy and support for LGBTQ business.
» Read more stats on Maryland
15. Milwaukee, WI
| 👪 In Good Company Family support is crucial for the well-being of LGBTQ individuals. With 0.13 PFLAG chapters per 100,000 residents, Milwaukee has 63% more chapters than the average city in our study (0.08). |
The Milwaukee metro area shines with 0.45 gay bars per 100,000 residents — 50% more than the 0.3 in the average city. Additionally, Milwaukee residents demonstrate a lower rate of opposition to same-sex marriage. Just 24% of Milwaukeeans oppose same-sex marriage, which is 11% less than the national average of 27%.
Furthermore, Wisconsin earned a state equality tally score of 18.5, an 11% higher than the average state tally score of 16.7.
» Read more stats on Wisconsin
Top LGBTQ-Friendly Cities by Category
The 10 Least LGBTQ-Friendly Cities
Countless cities across the U.S. have a substantial way to go toward being more LGBTQ-friendly. These are the 10 least LGBTQ-friendly cities in America:
- Memphis, Tennessee
- Houston, Texas
- Jacksonville, Florida
- Birmingham, Alabama
- Miami, Florida
- Dallas, Texas
- Oklahoma City, Oklahoma
- Tampa, Florida
- St. Louis, Missouri
- Kansas City, Missouri
What stands out in the bottom cities is that they all have particularly low state equality tally scores. The bottom 10 average a state equality tally score of -3.15, which is 119% lower than the average state's score of 16.7. Seven out of the bottom 10 cities are also in states that have a "Don't Say Gay" law, one of the most restrictive laws targeting LGBTQ Americans.
In addition, four of the bottom 10 cities don't have any NGLCC chapters, and they average just 0.75 LGBTQ-affirming health care providers per 100,000 residents — 46% fewer than the average metro in our study (1.4).
Despite ranking so low on LGBTQ-friendliness, some cities in our bottom 10 do have some bright spots. Houston is home to Pearl Bar, one of the few remaining lesbian bars in the country, while Kansas City declares itself an LGBTQ sanctuary city. As for Jacksonville, it's tied for the lowest percentage of residents opposing same-sex marriage, along with Hartford at 11%.
Memphis, our least LGBTQ-friendly city, struggles with its location in Tennessee, a state with several anti-LGBTQ laws. Tennessee's state equality tall score is -11.5, nearly 2x lower than the average state's score of 16.7. Thirty-six percent of its residents oppose same-sex marriage, which indicates it has less support for LGBTQ residents materially and in terms of community.
Methodology
Clever Real Estate compared the 50 most-populous U.S. metro areas across 14 metrics, listed below. Each metric was normalized and graded on a 100-point scale. The combined weighted average of each score determined the overall “most-friendly LGBTQ+ city” score upon which the final ranking was based.
Data points were attributed to metropolitan areas as much as possible. For some, data attributed to the largest city in the metropolitan area or state was used.
The metrics used are as follows:
- Percentage of state population that is LGBTQ+ (11.1%)
- PFLAG chapters per 100,000 residents (11.1%)
- LGBTQ+ affirming health care providers per 100,000 residents (9.5%)
- Count of state-level anti-trans legislation (9.5%)
- Pride events per 100,000 residents (9.5%)
- Count of NGLCC chapters (7.9%)
- Percentage of population opposing anti-discrimination laws (7.9%)
- Percentage of population opposing same-sex marriage (7.9%)
- Gay bars per 100,000 residents (4.8%)
- Human Rights Campaign's municipal equality index (4.8%)
- Movement Advancement Project's state equality tally score (4.8%)
- Presence of state-level inclusive curricular standards (4.8%)
- Presence of parental opt-out laws (3.2%)
- Presence of "Don't Say Gay" laws (3.2%)
Sources: Human Rights Campaign, The American Values Atlas provided by the Public Religion Research Institute (PRRI), National LGBT Chamber of Commerce (NGLCC), Parents and Friends of Lesbians and Gays (PFLAG), Movement Advancement Project (MAP), OutCare, Yelp, Google Trends, and Gaypridecalendar.com.
About Clever Real Estate
Since 2017, Clever Real Estate has been on a mission to make selling or buying a home easier and more affordable for everyone. About 12 million annual readers rely on Clever's library of educational content and data-driven research to make smarter real estate decisions, and to date, Clever has helped consumers save more than $160 million on Realtor fees. Clever's research has been featured in The New York Times, Business Insider, Inman, Housing Wire, and many more.
More Research from Clever
American Home Buyer and Seller Report (2023 Edition): To learn how buyers and sellers are navigating this bizarre new market, we surveyed 1,000 Americans who purchased a home in 2022 and 2023.
The Best and Worst Cities for Commuters in 2023: We ranked the most commuter-friendly cities as well as the best cities for public transit in the U.S. in this comprehensive study.
1 in 4 Americans Think Marriage Is an Outdated Concept in 2023: We surveyed 1,000 adult Americans about their views on marriage, their relationship deal breakers, and other topics related to the institution.
Articles You Might Like
11 Best Companies That Buy Houses for Cash: Looking to sell your home fast? We found the best companies that buy houses for cash.
The Best Low Commission Realtors and Brokers (2023 Update): Find out who the best low commission real estate brokers are in 2023, including Clever, Redfin, and more.
Best 1 Percent Commission Realtors Across the U.S.: This guide breaks down the top brands offering a 1% realtor commission (or close to it).
Frequently Asked Questions About the Most LGBTQ-Friendly Cities in the U.S.
What is the most accepting city of LGBT?
Defining a city as most "accepting" can be difficult because of differing state-level policies, municipal policies, and public support. We look at each of these metrics in this study. Check out how your city stacks up.
Where are the most LGBTQ-friendly cities?
The top three most LGBTQ-friendly cities in the U.S. are San Francisco, Hartford, and Las Vegas. Learn more.
Where is the best place for LGBTQ families to live?
The Parents and Friends of Lesbians and Gays network is a national organization with hundreds of chapters around the country. Cities with PFLAG chapters can be great for LGBTQ families because of the support they provide. Columbus, Washington, D.C., New York City, Cleveland, and San Jose are all tied for having the most PFLAG chapters per 100,000 residents at 0.05 each. Learn more.